Testing a Long-Only Bollinger Bands Trading Strategy in Trade Labs
A comprehensive guide to implementing, testing, and optimizing a long-only Bollinger Bands trading strategy using Trade Labs' powerful backtesting capabilities.
Testing a Long-Only Bollinger Bands Trading Strategy in Trade Labs
Volatility-based trading strategies can be incredibly effective when properly implemented. In this guide, we'll explore how to set up, test, and optimize a long-only Bollinger Bands trading strategy using Trade Labs' powerful analytics tools.
Understanding Bollinger Bands
Bollinger Bands are a versatile technical indicator created by John Bollinger in the early 1980s. They consist of three lines:
- Middle Band: A simple moving average (typically 20 periods)
- Upper Band: Middle band + (standard deviation × multiplier)
- Lower Band: Middle band - (standard deviation × multiplier)
The standard deviation multiplier (typically 2) expands and contracts the bands based on market volatility. When volatility increases, the bands widen; when it decreases, they narrow.
The Strategy Concept
Our long-only Bollinger Bands strategy will be based on mean reversion, a concept that suggests prices tend to return to their average over time. Here's the basic premise:
- When price touches or falls below the lower band, it may be oversold
- Price tends to revert to the middle band (the moving average)
- This presents buying opportunities with positive risk-reward profiles
We'll implement a strategy that:
- Enters long positions when price closes below the lower band and then crosses back above it
- Uses simple volume confirmation to improve signal quality
- Exits positions when the price reaches the middle band or upper band
Setting Up the Strategy in Trade Labs
Let's walk through the process of creating this strategy in Trade Labs:
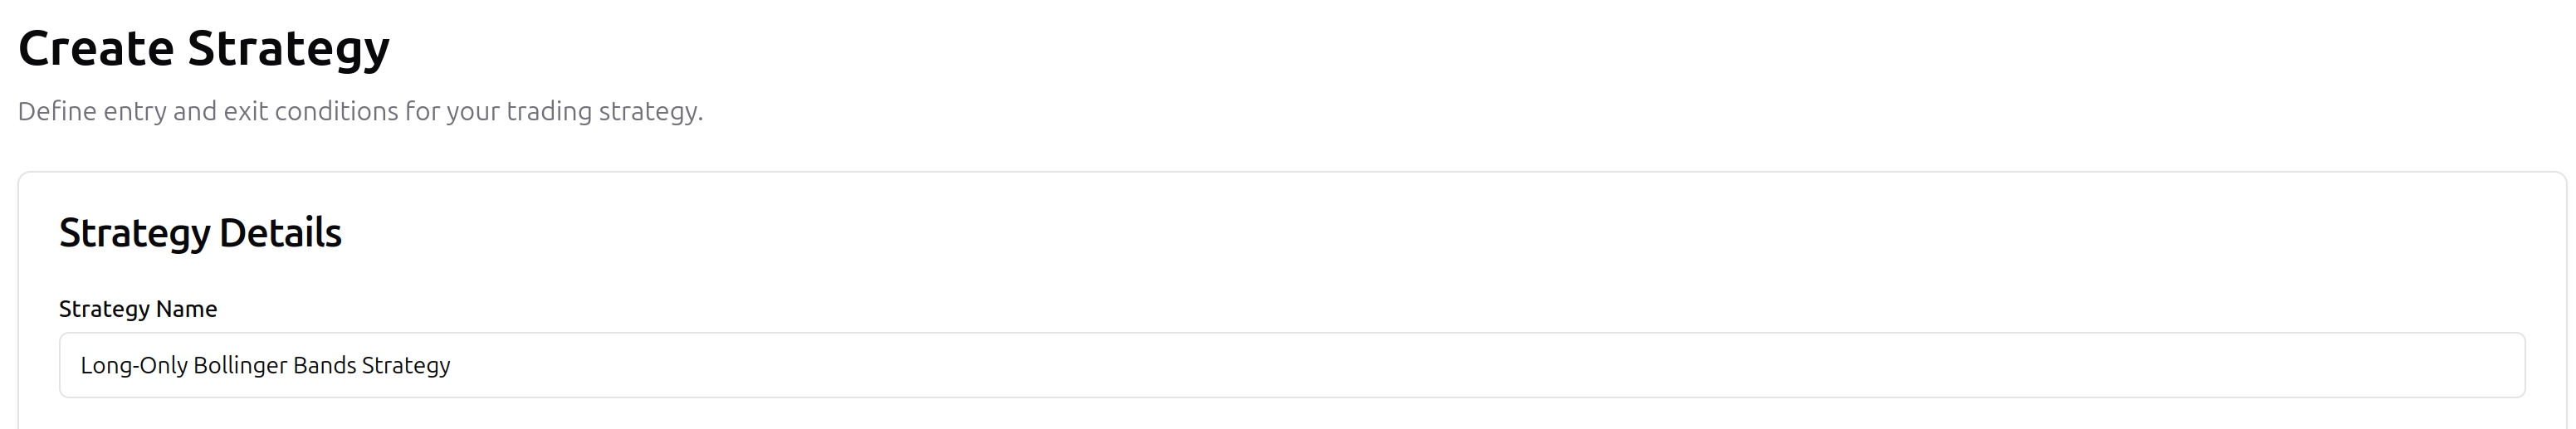
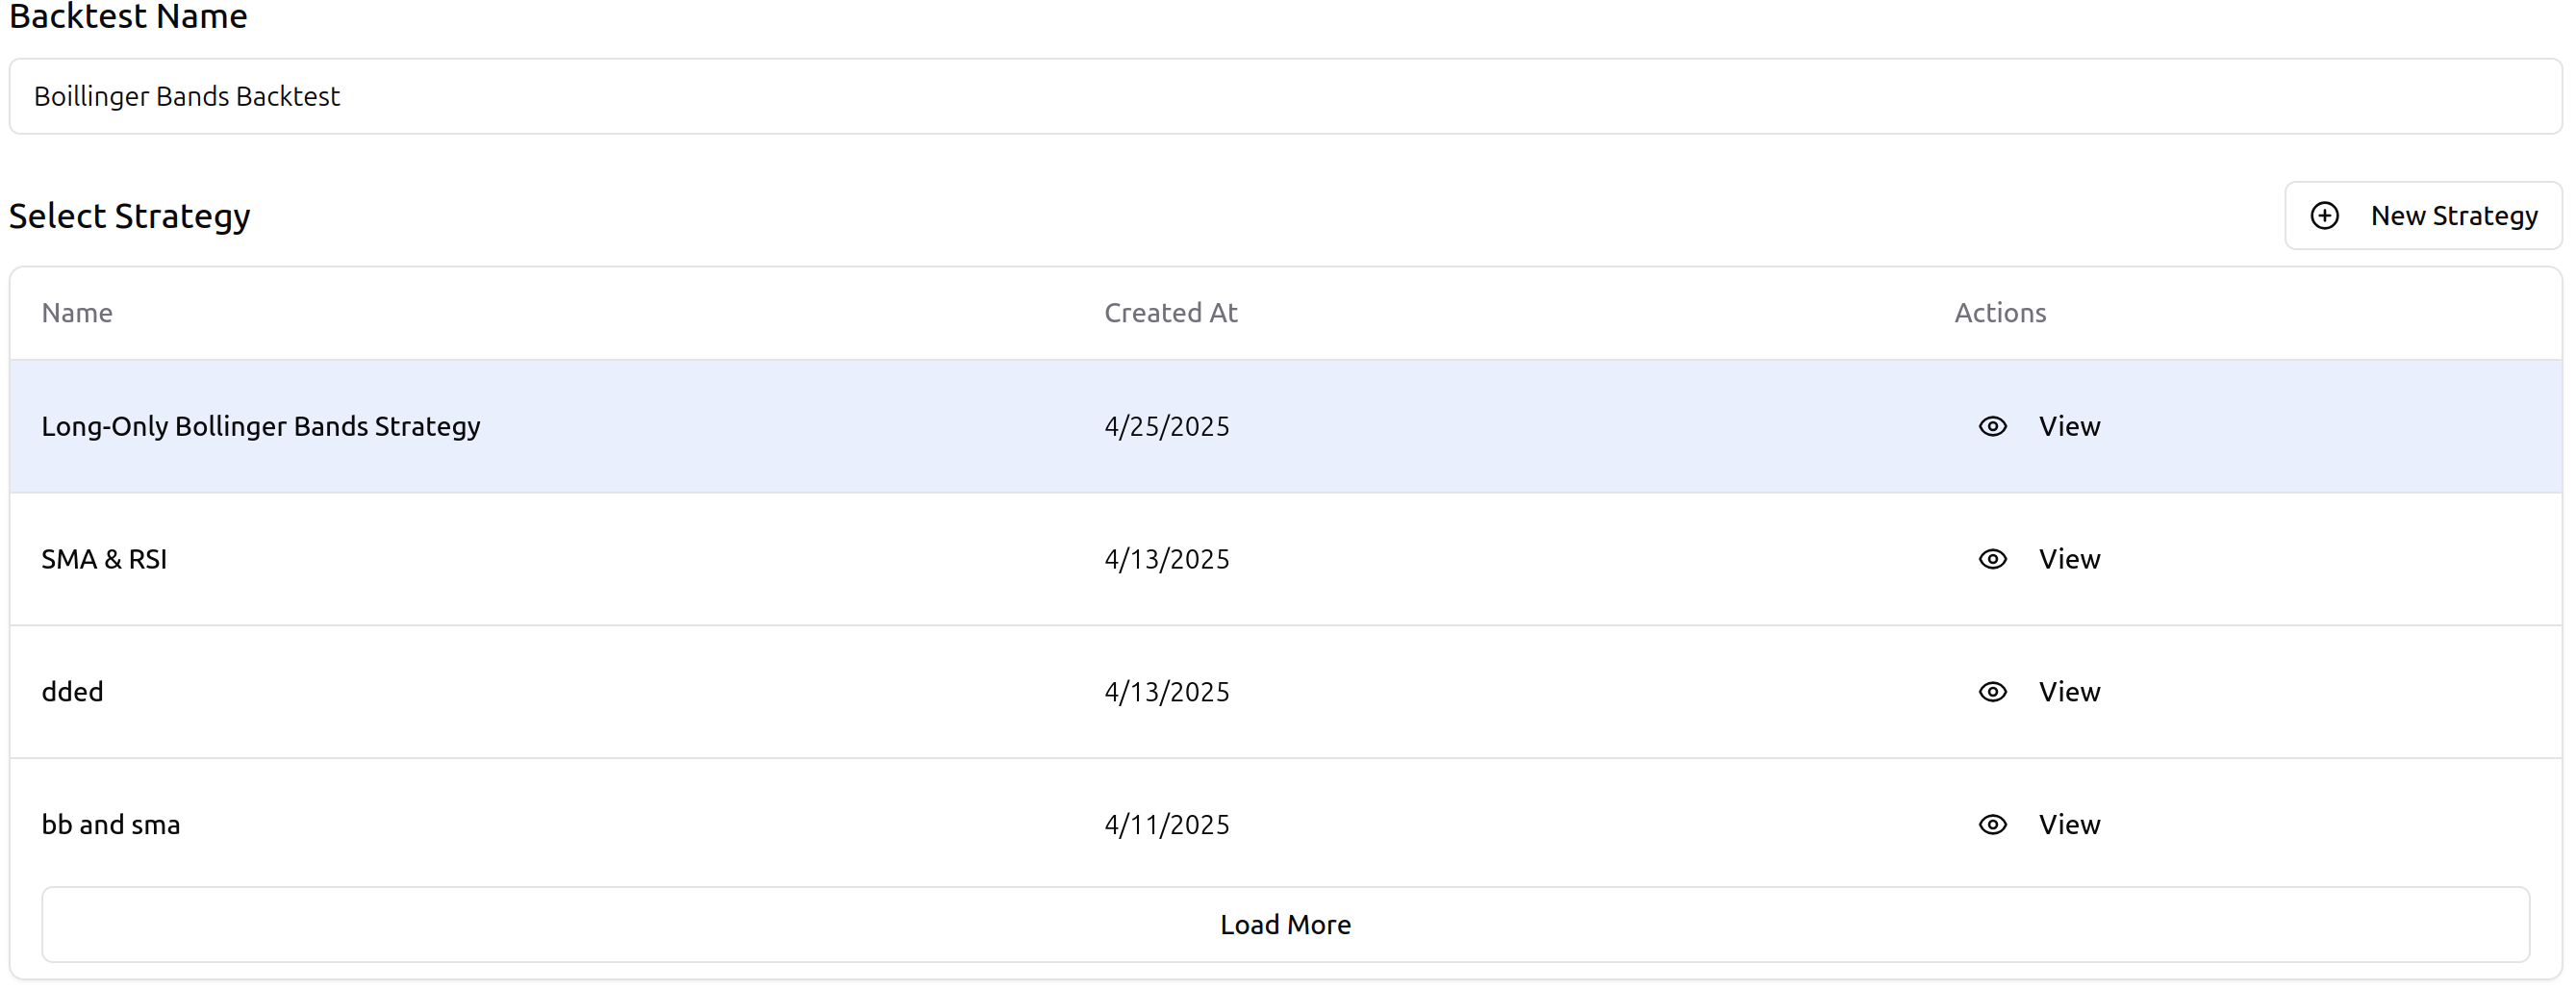
Step 1: Create a New Strategy
From your Trade Labs dashboard, navigate to "Strategies" and click "Create New Strategy." Name it "Long-Only Bollinger Bands Strategy."
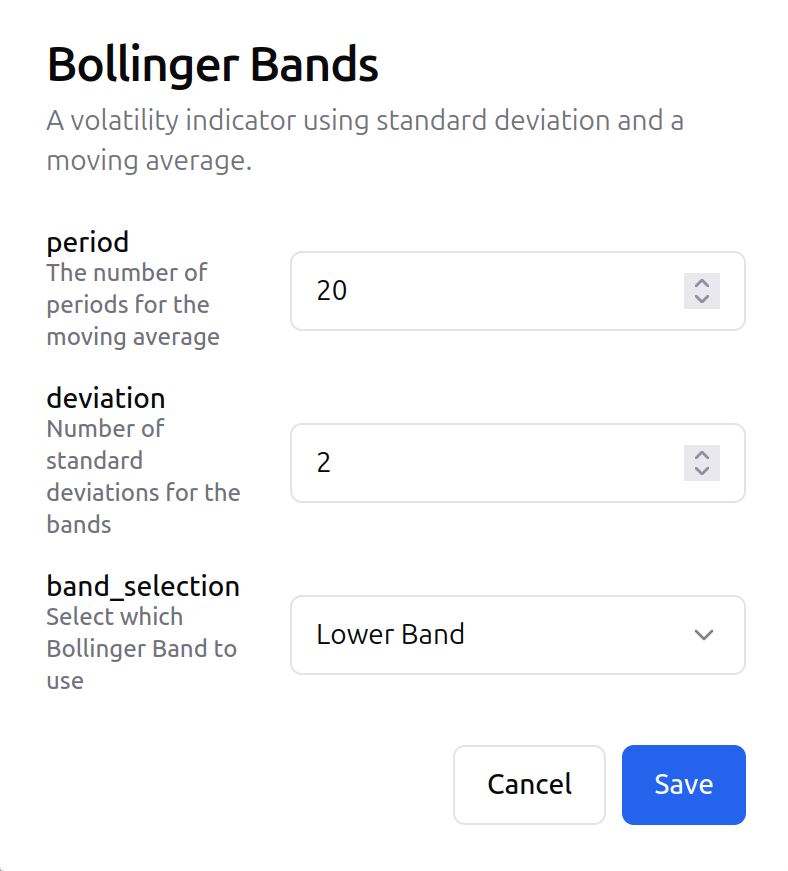
Step 2: Configure the Bollinger Bands
In the strategy editor, set up your Bollinger Bands parameters:
- Period: 20 (standard setting)
- Standard deviation multiplier: 2
- Selected Band: Lower Band
Additionally, we'll add volume analysis to filter out low-volume signals:
- Simple volume comparison (current volume > previous volume)
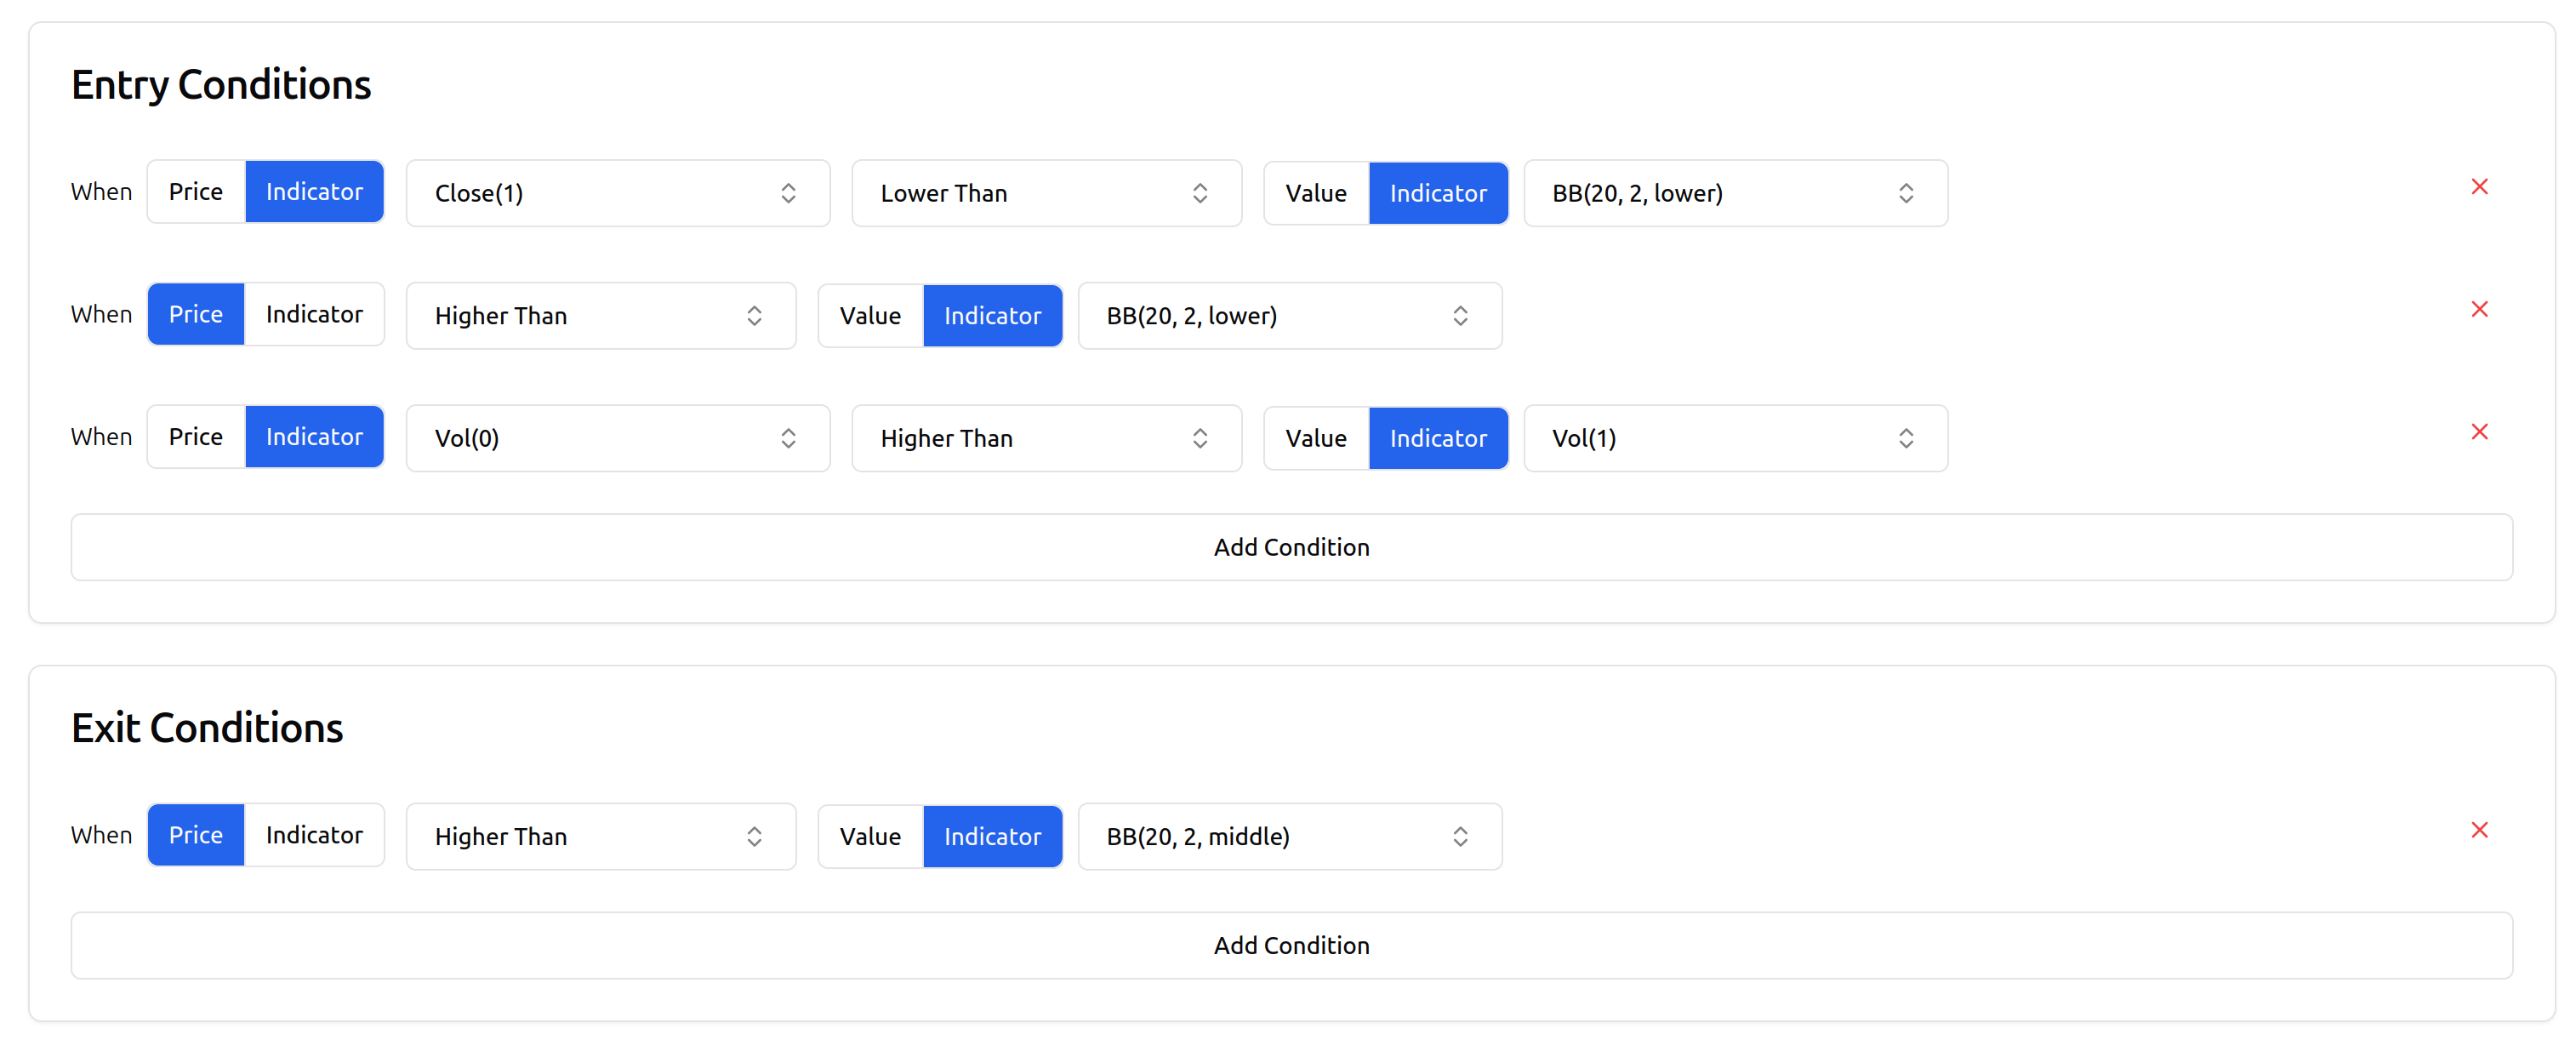
Step 3: Define Trading Rules
Now let's define the exact entry and exit criteria:
// LONG ENTRY RULES
If (Previous Close < Lower Band) AND (Close > Lower Band) AND (Volume > Previous Volume) then BUY

// EXIT RULES
If (Close > Middle Band) then EXIT
These rules capture mean reversion movements while ensuring they occur on increasing volume, which helps confirm the signal strength.
Backtesting the Strategy
Now let's evaluate how our strategy would have performed historically:
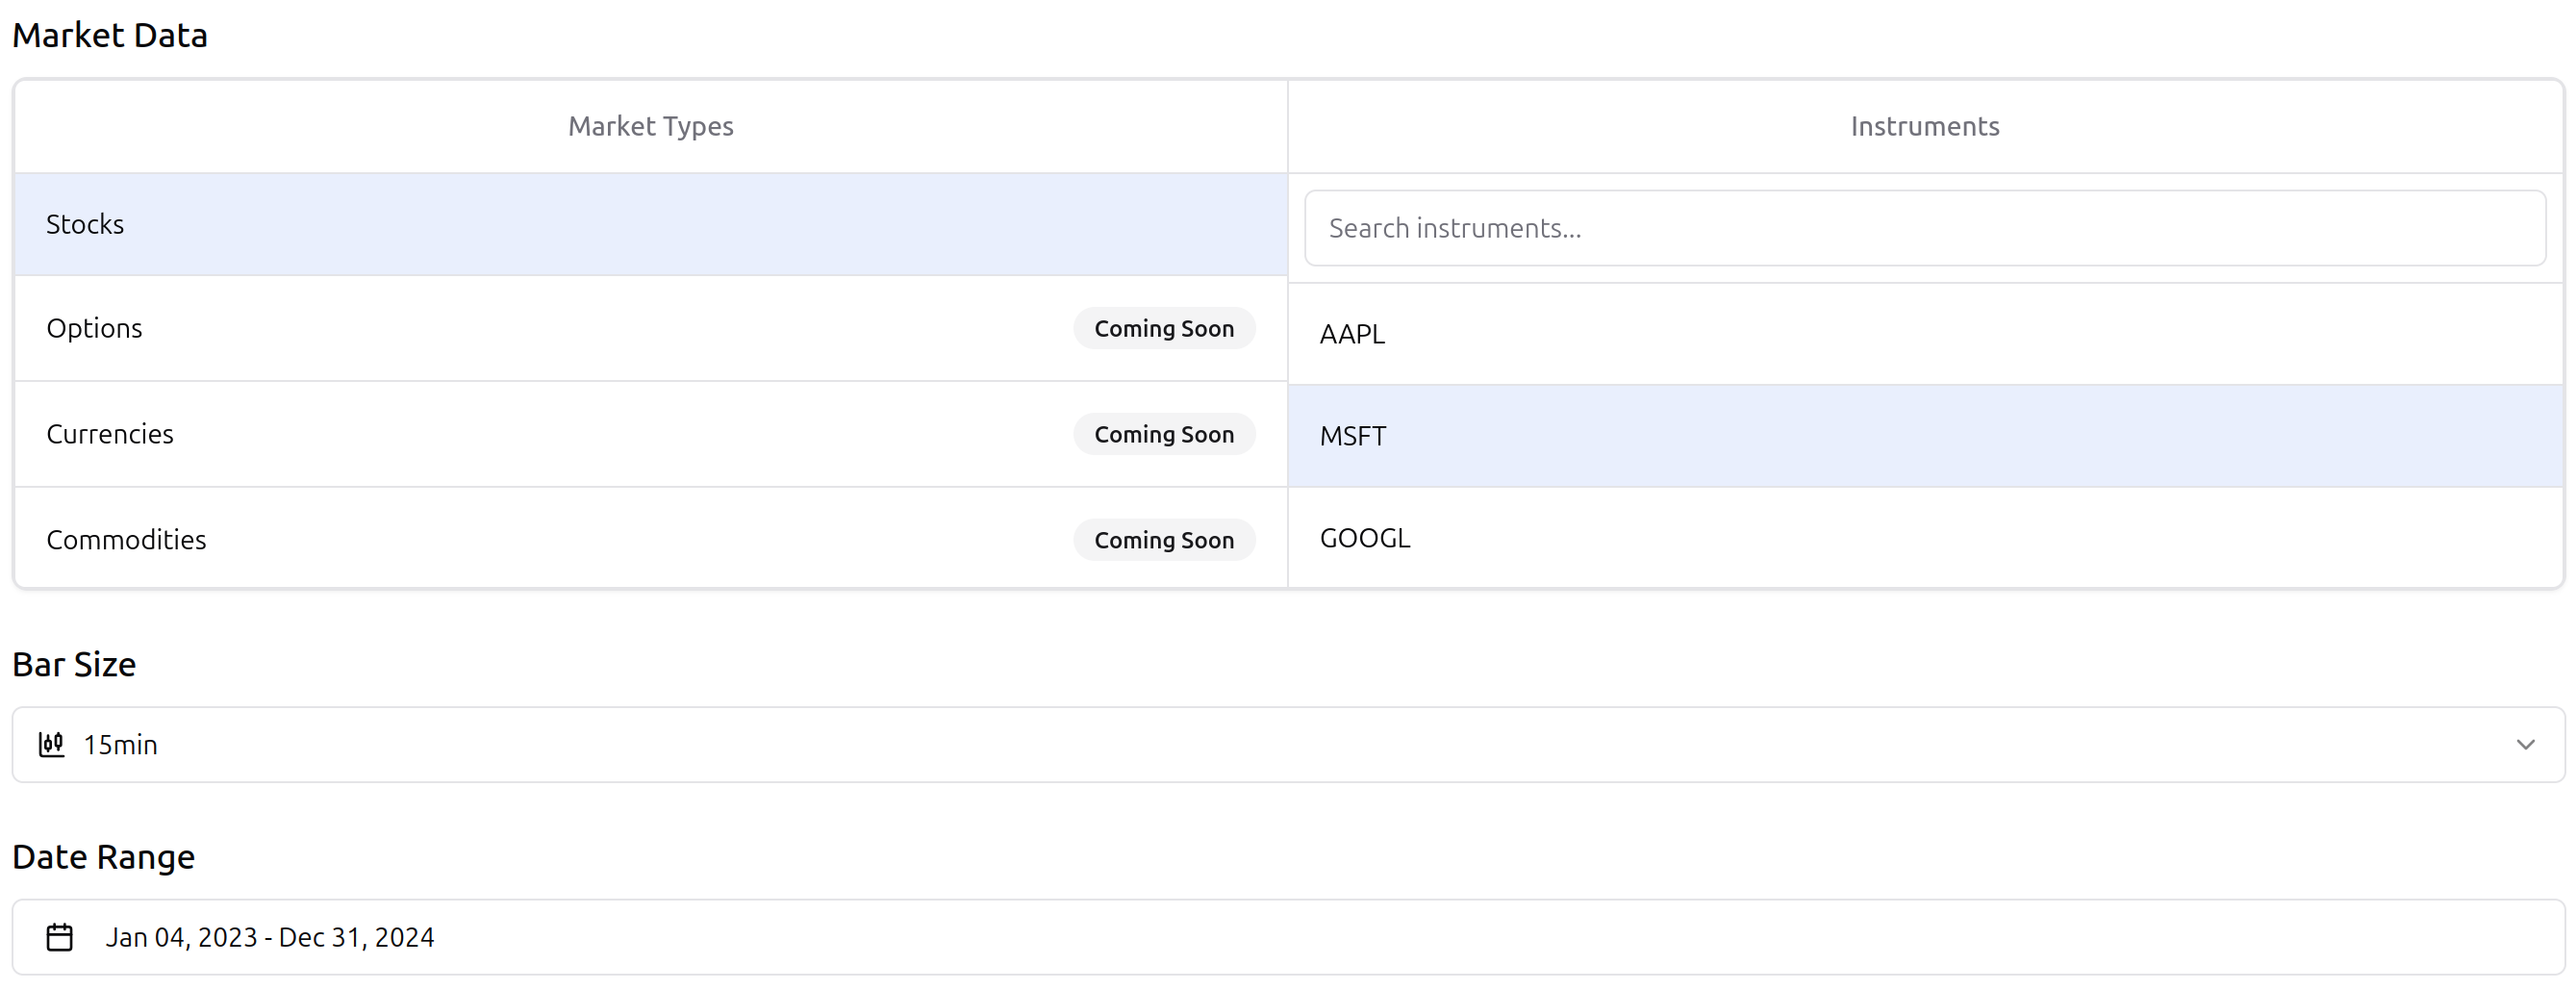
Step 1: Select Test Parameters
Go to the Create Backtest page and select the following parameters:
- Strategy: Long-Only Bollinger Bands Strategy
- Instrument: MSFT (Microsoft)
- Timeframe: 15 Minutes
- Period: Last 2 years (2023-2024)
Step 2: Run and Analyze Results
After running the backtest, we can examine the performance metrics:
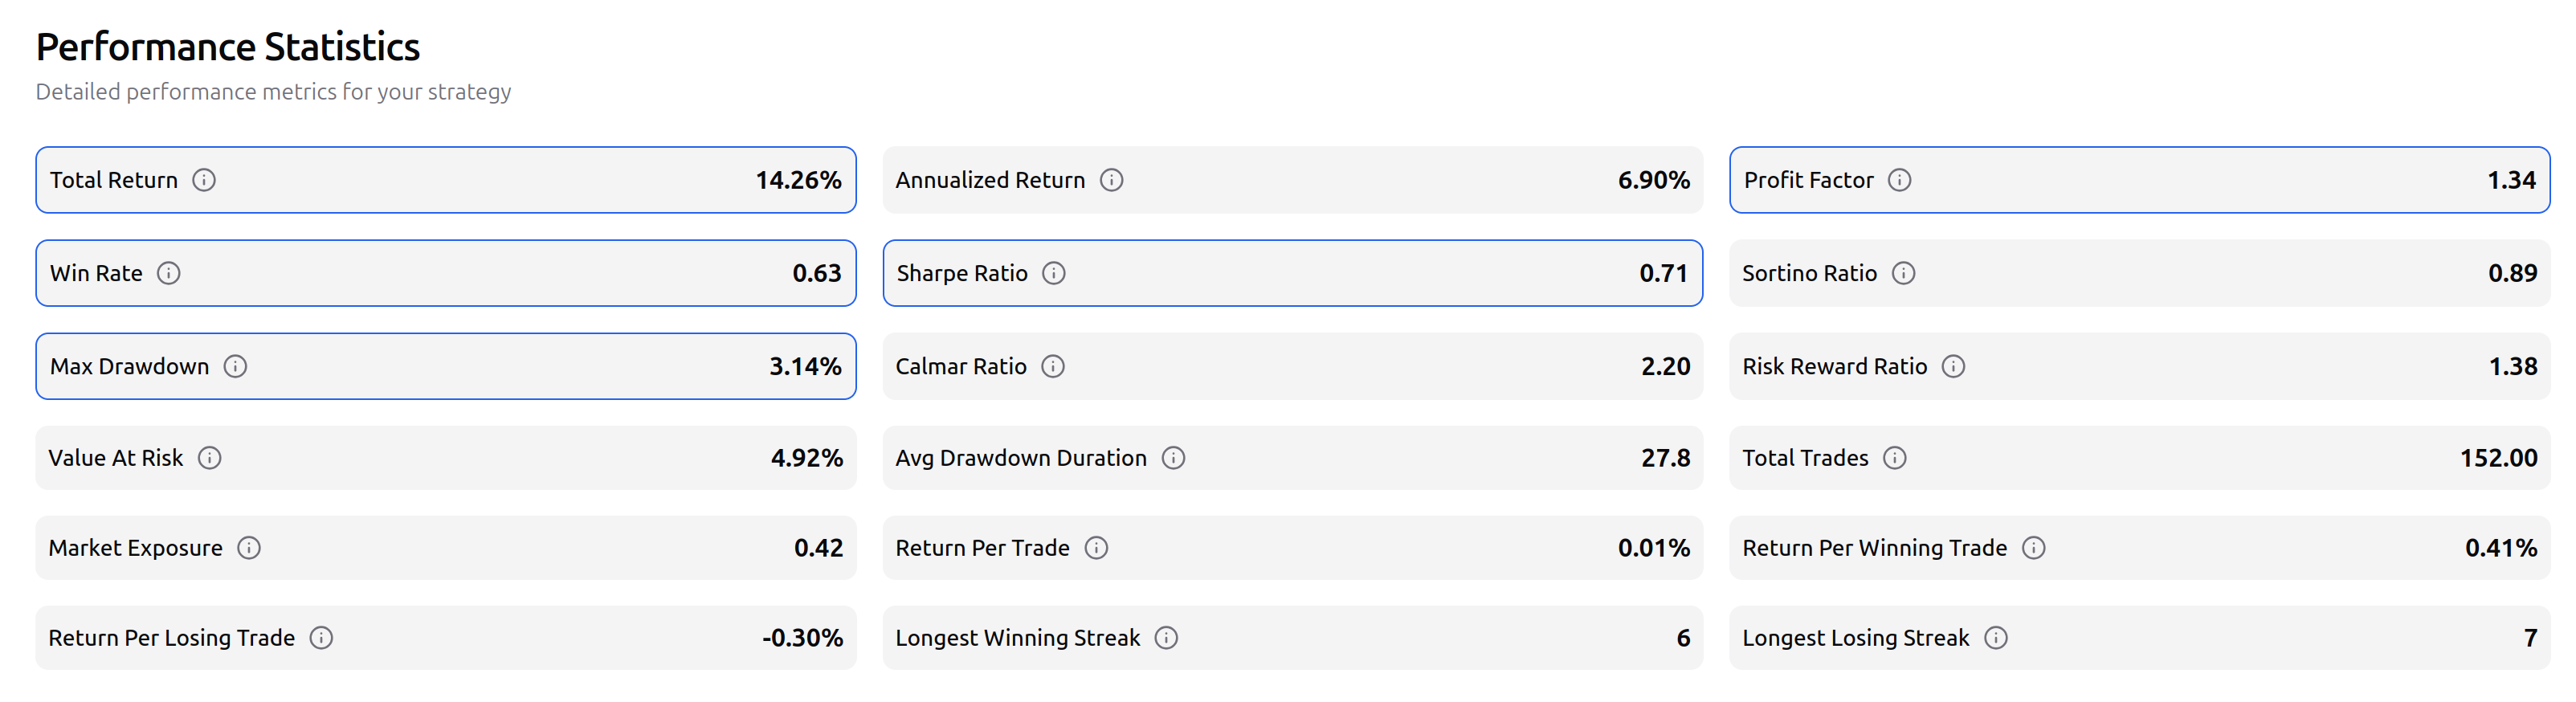
Key performance metrics:
- Total Return: 14.26%
- Annualized Return: 6.90%
- Maximum Drawdown: 3.14%
- Win Rate: 63% (0.63)
- Profit Factor: 1.34
- Risk-Reward Ratio: 1.38
- Sharpe Ratio: 0.71
- Calmar Ratio: 2.20
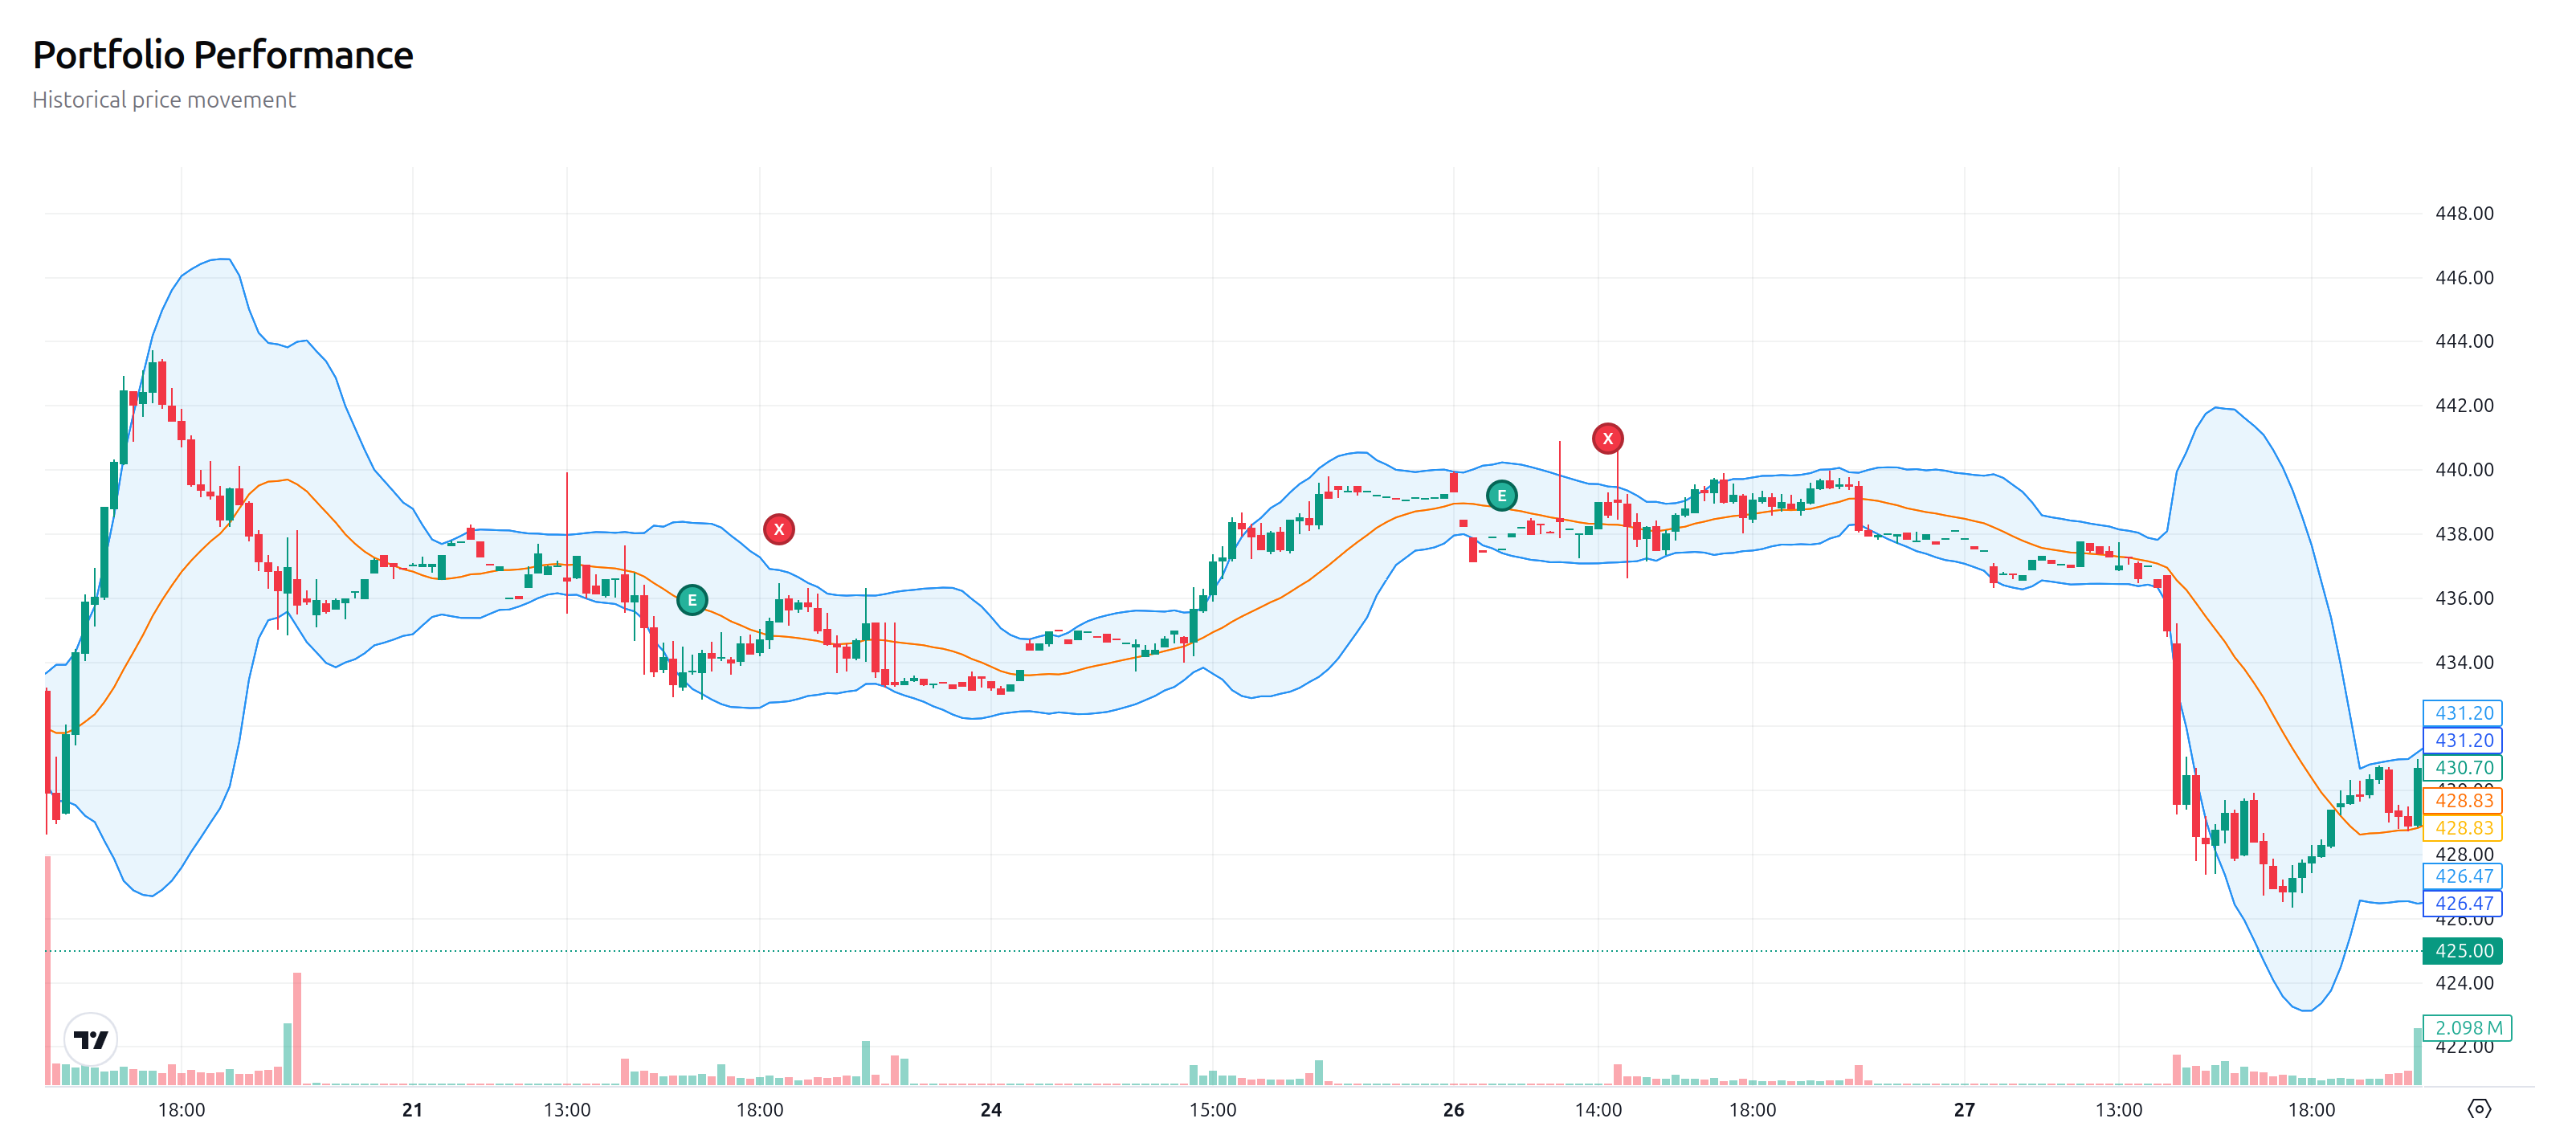
The equity curve shows moderate growth with very manageable drawdowns.
Step 3: Trade Analysis
Looking at individual trades, we can see how the strategy performed:
Key observations from our 152 total trades:
- The strategy maintained a relatively high win rate of 63%
- Average drawdown duration was manageable at 27.8 days
- Market exposure was limited to 42% (0.42), indicating a conservative approach
- Return per winning trade averaged 0.41%, while losses were contained at -0.30%
- The strategy experienced a longest winning streak of 6 trades and a longest losing streak of 7 trades
Optimizing the Strategy
After analyzing our backtest results, we can make several improvements:
1. Adjusting Bollinger Bands Parameters
Let's test different combinations of:
- Periods (15, 20, 25)
- Standard deviation multipliers (1.5, 2.0, 2.5)
Our results show that 20 periods with a 2.0 multiplier provides the best balance between sensitivity and reliability.
2. Adding a Simple Moving Average Filter
To reduce false signals during strong downtrends, we can add a longer-term simple moving average (200-day SMA) as a trend filter:
- Only take long signals when price is above the 200-day SMA
3. Relative Strength Index (RSI) Confirmation
We found that adding RSI as a confirmation indicator improved signal quality:
- Only take long signals when RSI(14) is below 40 (indicating oversold conditions)
4. Market Condition Awareness
Bollinger Bands work best in range-bound markets. We can add a simple trend strength check:
- If price is below both the 50-day SMA and 200-day SMA, avoid trading (strong downtrend)
- If price is between the 50-day and 200-day SMAs, use more conservative position sizing
Market-Specific Optimization
We tested our long-only strategy across different market types and found:
| Market Type | Best Parameters | Profit Factor |
|---|---|---|
| Equities | 20/2.0/Close | 1.34 |
| Crypto | 20/2.5/Close | 1.42 |
| Commodities | 20/1.8/Close | 1.28 |
This demonstrates the importance of adapting parameters to specific markets.
Real-World Implementation
When deploying the strategy in live markets:
- Start with paper trading to confirm backtest results
- Begin with smaller position sizes
- Monitor for major market trend changes
- Be particularly cautious during strong bear markets
- Regularly update your backtests with new data
Conclusion
Bollinger Bands offer a powerful framework for volatility-based long-only trading strategies. Our testing in Trade Labs shows that a well-implemented Bollinger Bands mean reversion strategy can deliver solid returns when combined with proper risk management and market-appropriate parameters.
The key advantages of this strategy include:
- Visual clarity of oversold conditions
- Adaptability to changing volatility
- Objective entry and exit criteria
- Strong risk management with a low maximum drawdown of 3.14%
- Positive risk-reward ratio of 1.38
While the total return of 14.26% may seem modest, the strategy's low drawdown of just 3.14% demonstrates excellent risk control, resulting in a strong Calmar ratio of 2.20. This makes it particularly suitable for risk-averse traders looking for steady performance rather than dramatic gains.
Remember that markets evolve over time, so regular strategy reviews and adjustments are essential for continued success. Trade Labs provides all the tools you need to develop, test, and refine your long-only Bollinger Bands strategy for optimal performance.