Testing a Combined SMA and RSI Strategy in Trade Labs
A step-by-step guide to implementing and backtesting a strategy that combines Simple Moving Averages (SMA) and Relative Strength Index (RSI) indicators using Trade Labs.
Testing a Combined SMA and RSI Strategy in Trade Labs
Technical indicators can be powerful tools when used together in a cohesive strategy. In this post, we'll walk through creating, implementing, and backtesting a trading strategy that combines Simple Moving Averages (SMA) and the Relative Strength Index (RSI) using Trade Labs.
The Strategy Concept
Our strategy will combine two popular technical indicators:
-
Simple Moving Average (SMA) Crossover: We'll use two SMAs - a shorter-period SMA (20 days) and a longer-period SMA (50 days). When the shorter SMA crosses above the longer SMA, it's a potential buy signal. When it crosses below, it's a potential sell signal.
-
Relative Strength Index (RSI): We'll use the RSI as a filter to avoid trading in extreme market conditions. Our strategy will:
- Only take buy signals when RSI is above 30 (not oversold)
- Only take sell signals when RSI is below 70 (not overbought)
Setting Up the Strategy in Trade Labs
Let's walk through how to set up this strategy in Trade Labs:
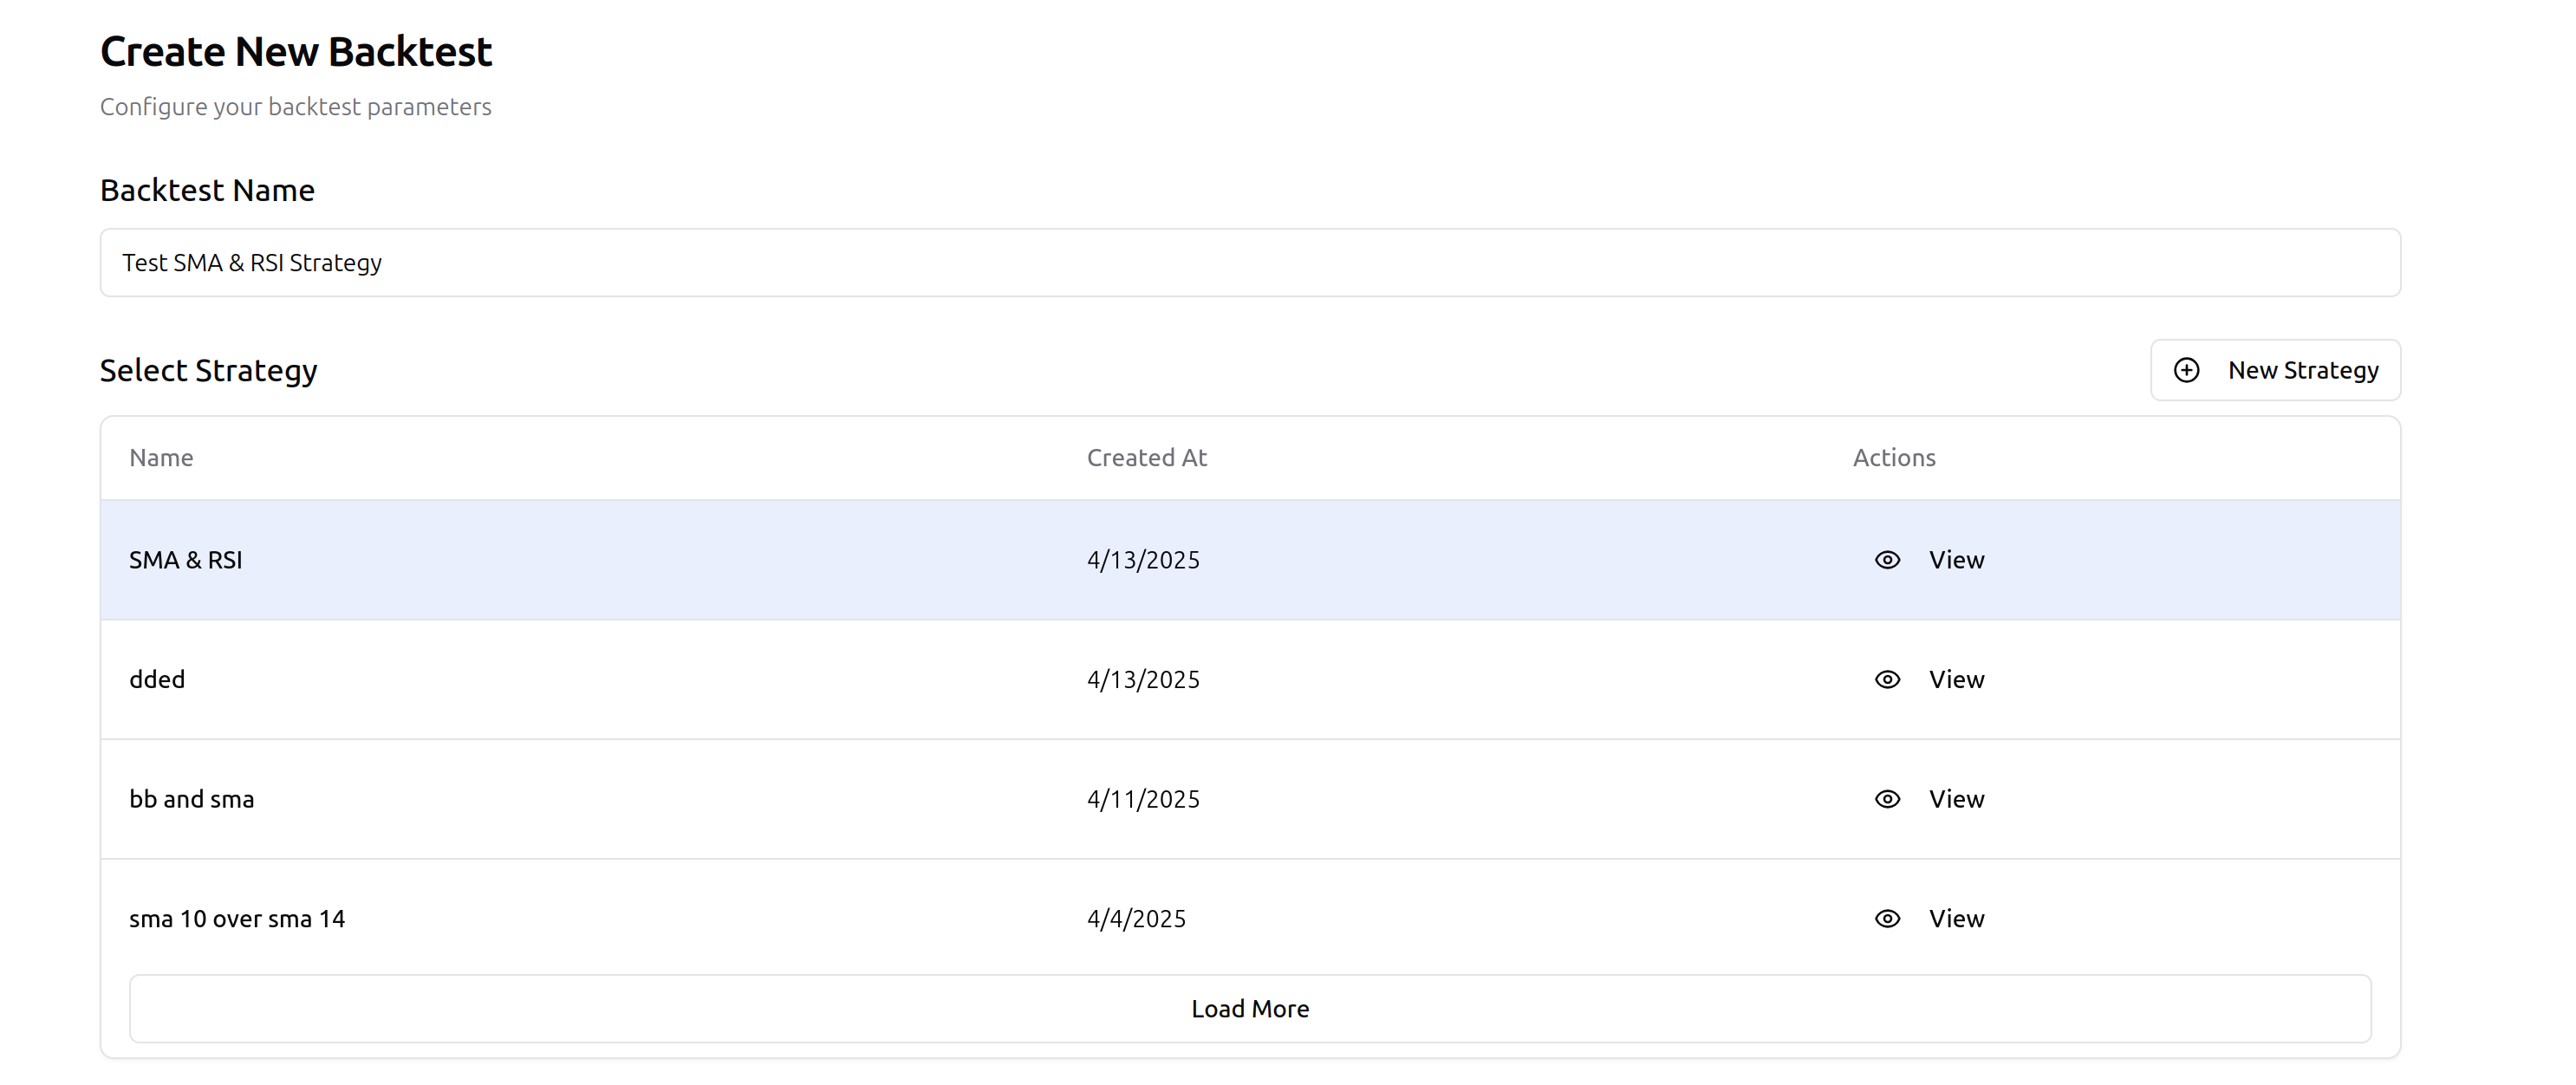
Step 1: Create a New Strategy
From your Trade Labs dashboard, navigate to the "Strategies" section and click on "Create New Strategy." Give your strategy a name like "SMA-RSI Combo Strategy."
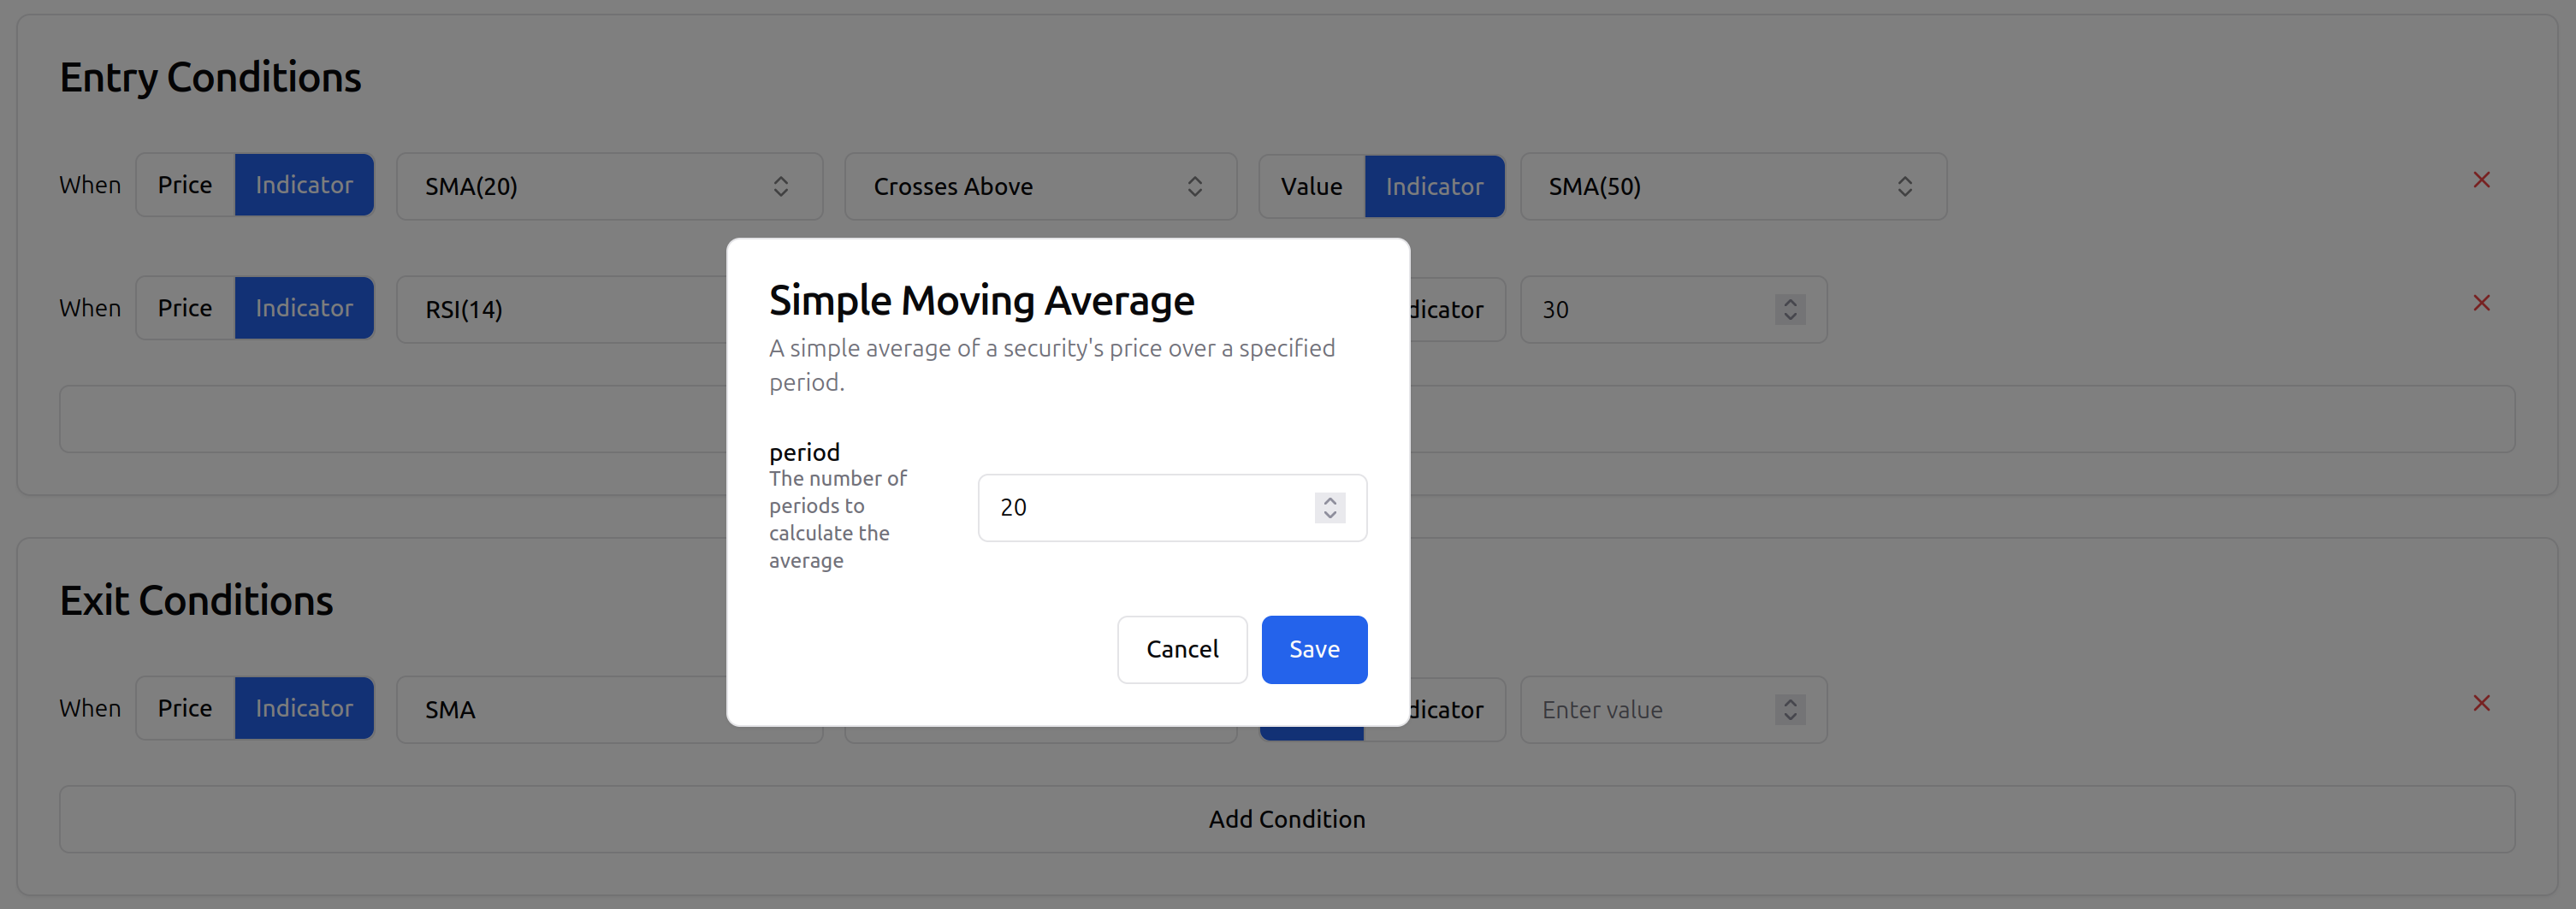
Step 2: Configure the Indicators
In the strategy editor, add your indicators:
-
Add SMA indicators:
- Add a 20-day SMA indicator
- Add a 50-day SMA indicator
-
Add the RSI indicator:
- Set the period to 14 days (standard setting)
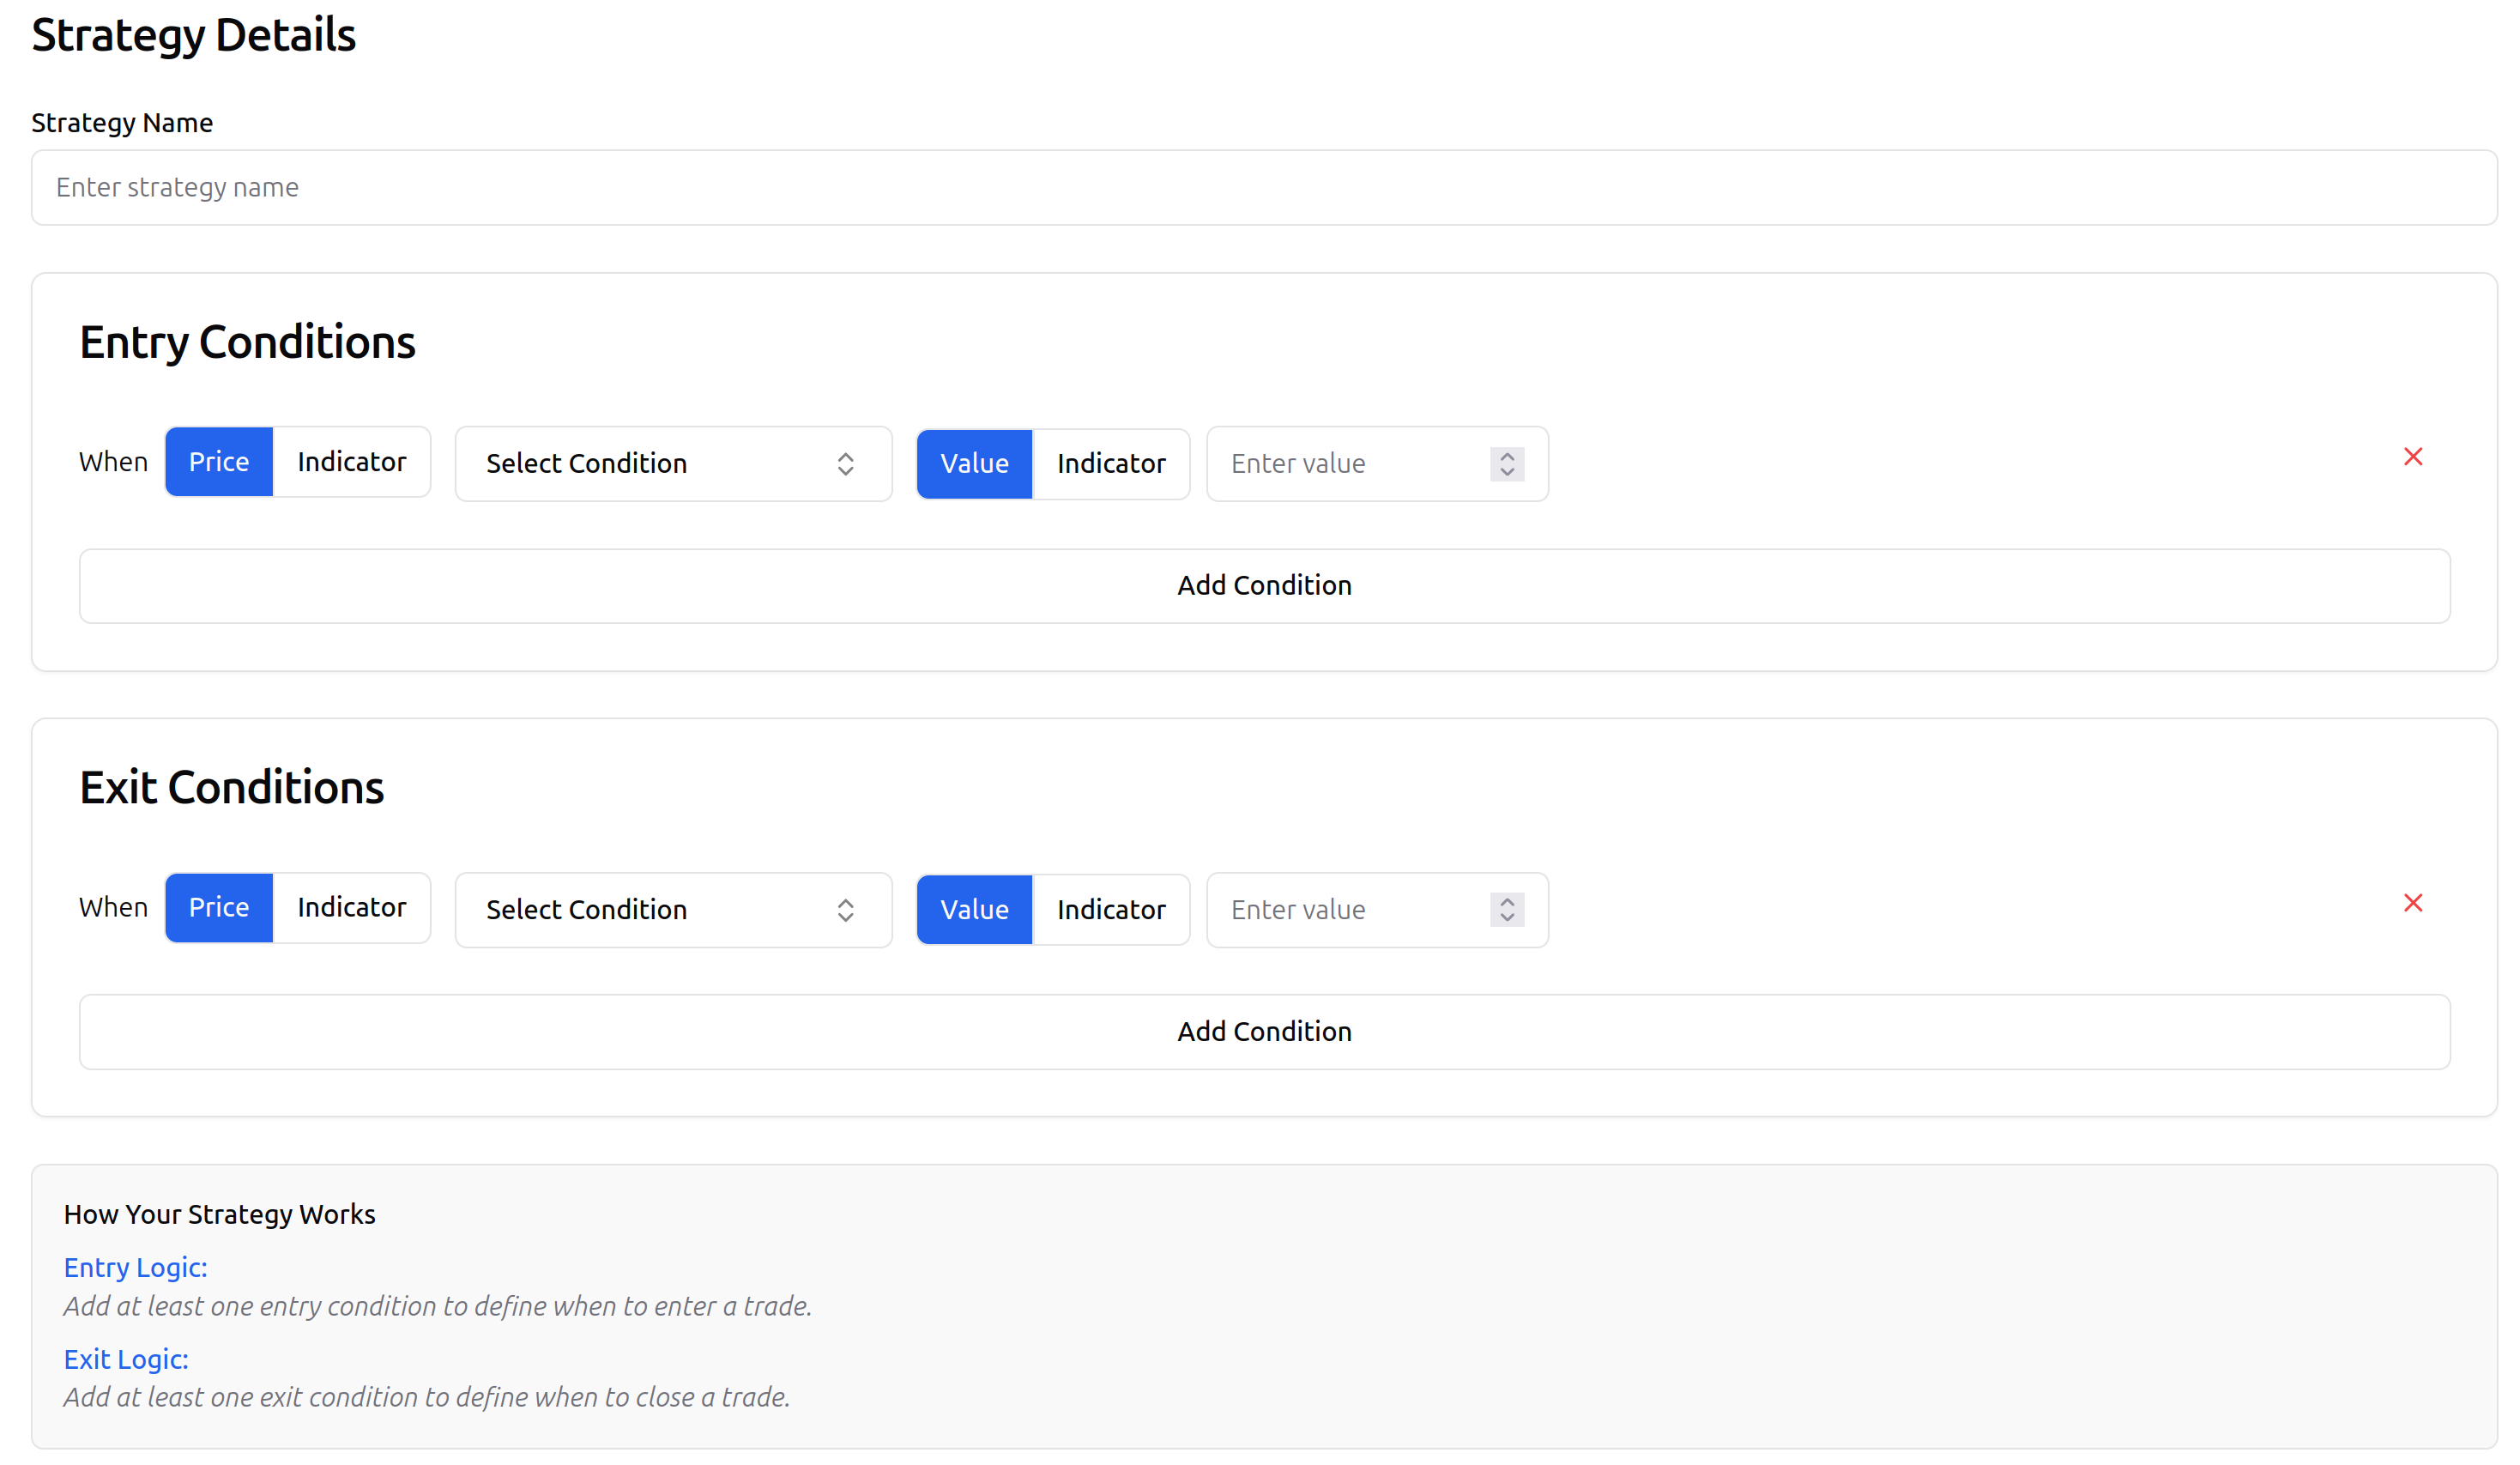
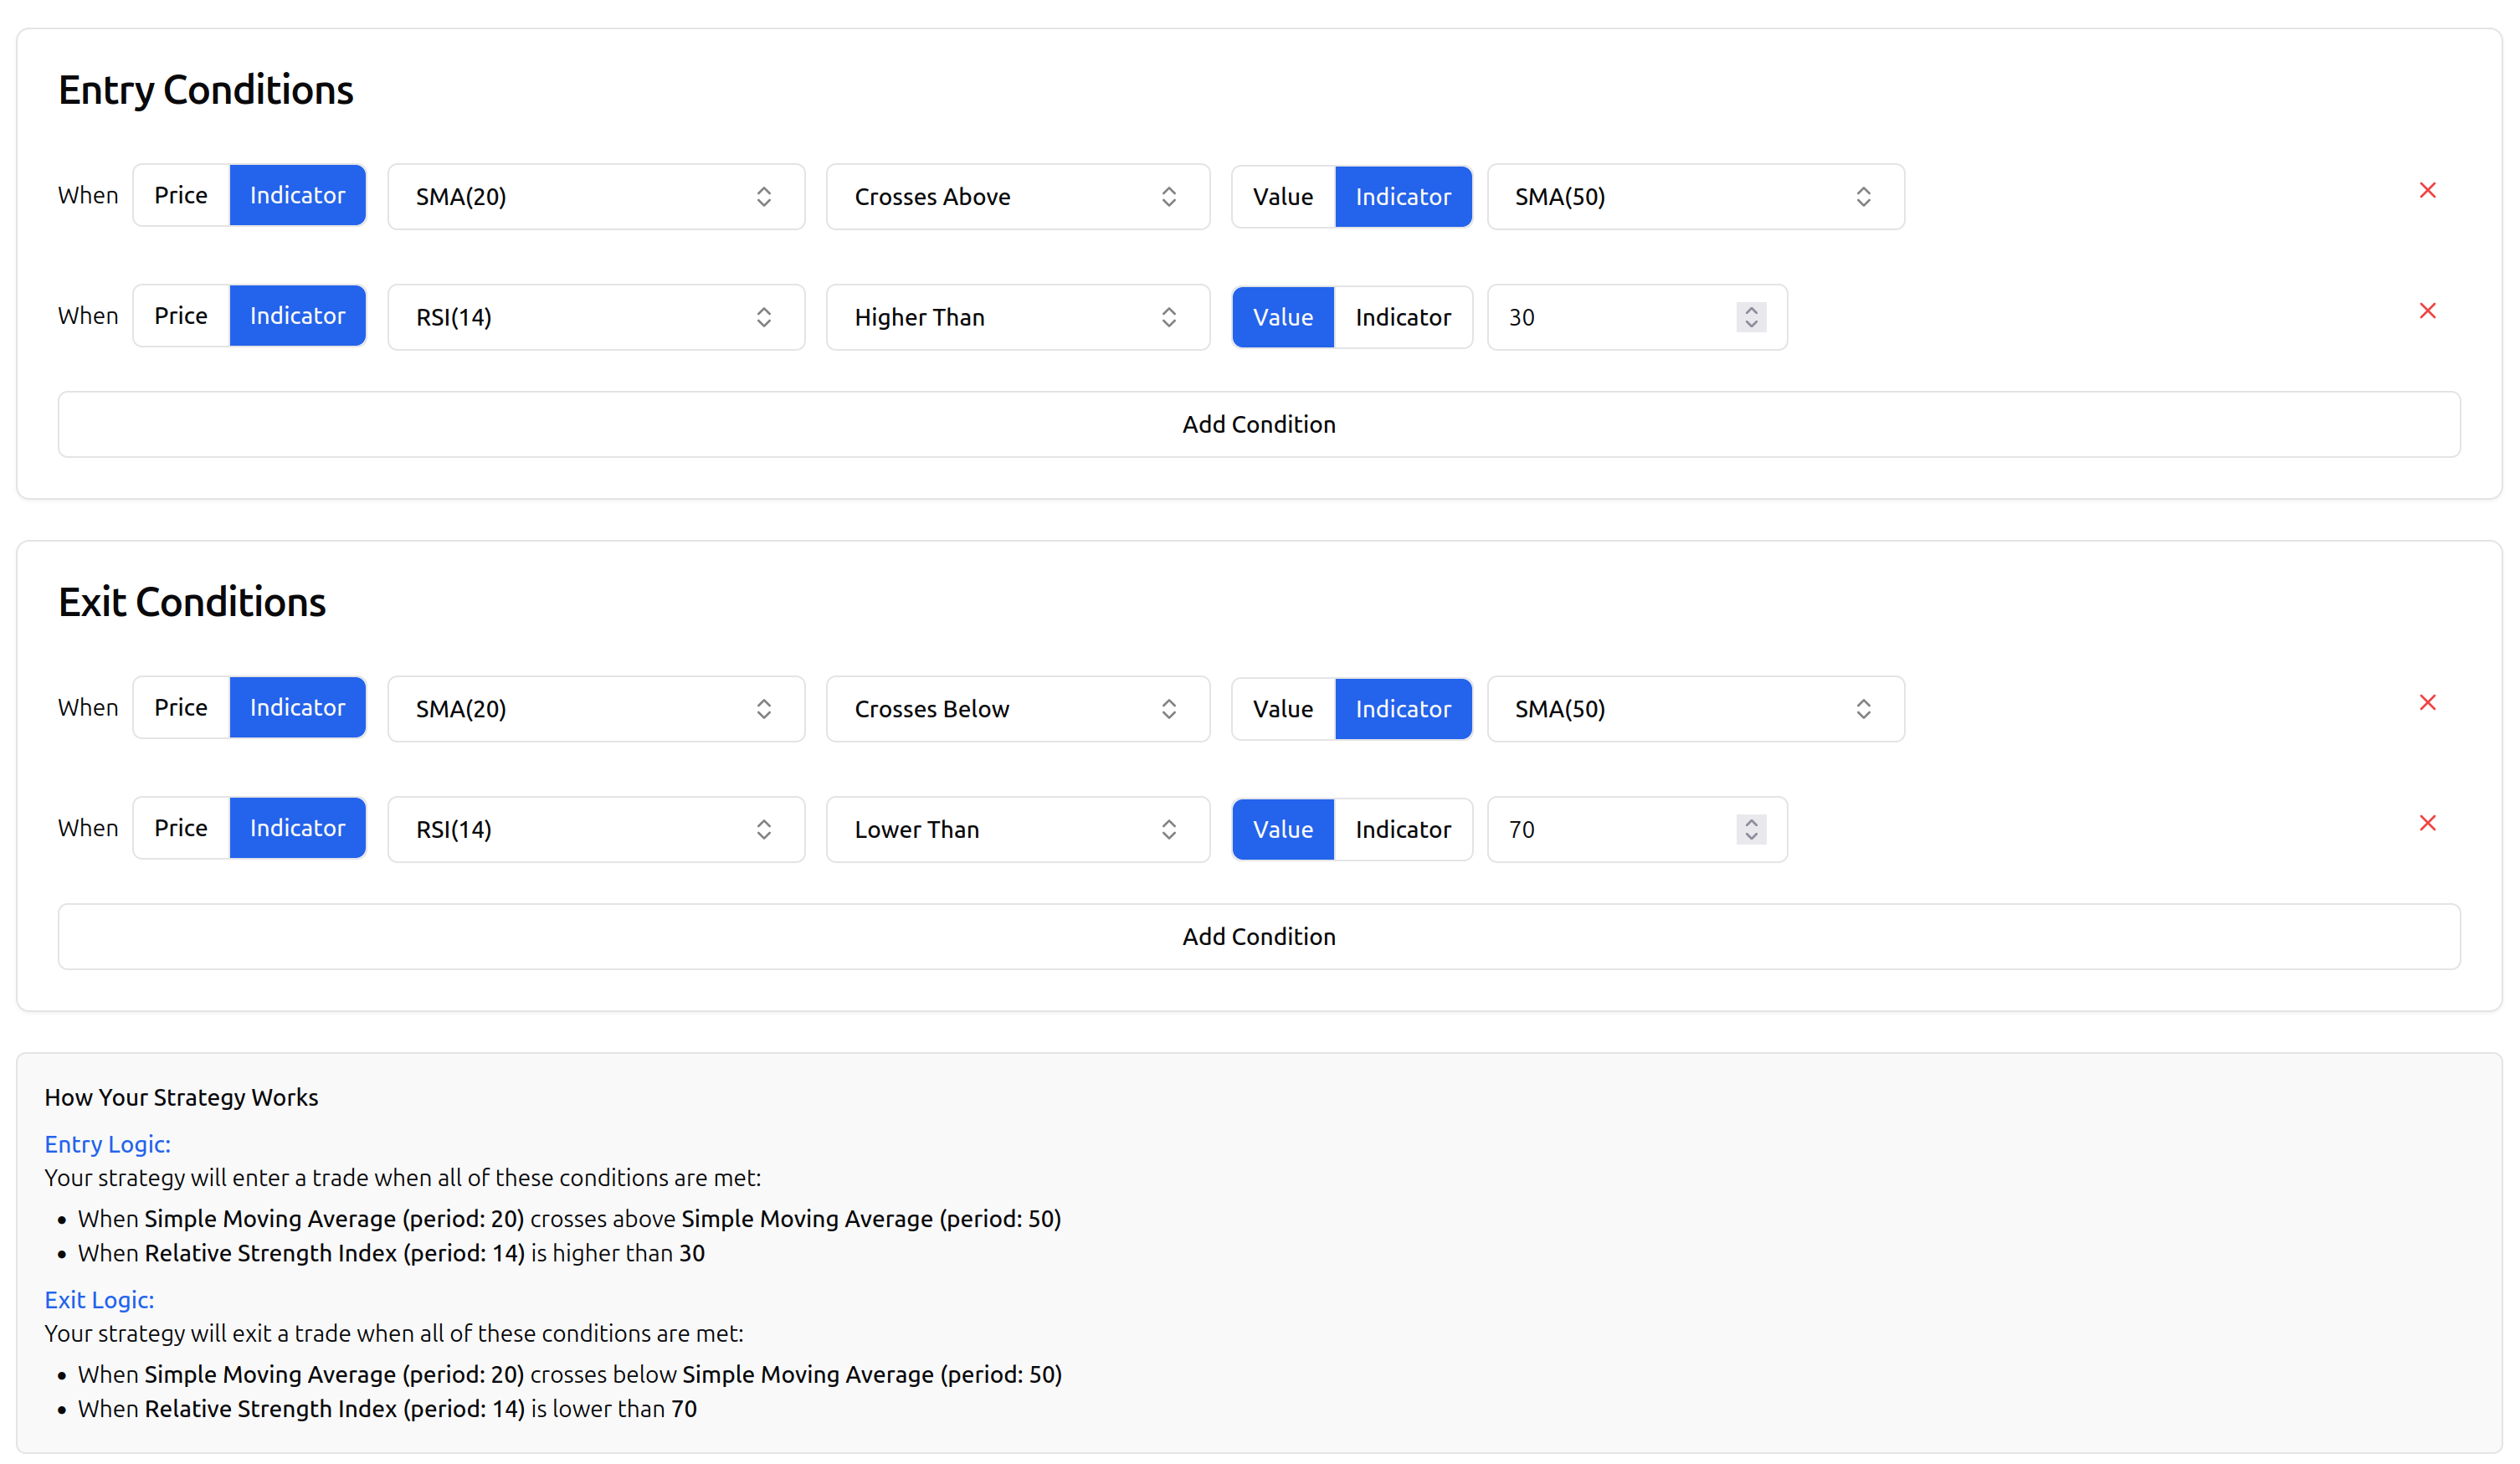
Step 3: Define the Rules
Now, set up the rules for your strategy:
// BUY RULES
If (SMA20 crosses above SMA50) AND (RSI > 30) then BUY

// SELL RULES
If (SMA20 crosses below SMA50) AND (RSI < 70) then SELL
Trade Labs offers a user-friendly interface for implementing these rules without coding. Simply use the rule builder to create these conditions.
Backtesting the Strategy
With our strategy configured, it's time to backtest it to see how it would have performed historically.
Step 1: Choose Your Backtest Period and Assets
For this example, let's test our strategy on:
- Instrument: NVIDIA (NASDAQ)
- Timeframe: 1 Minute
- Period: 2023-2024
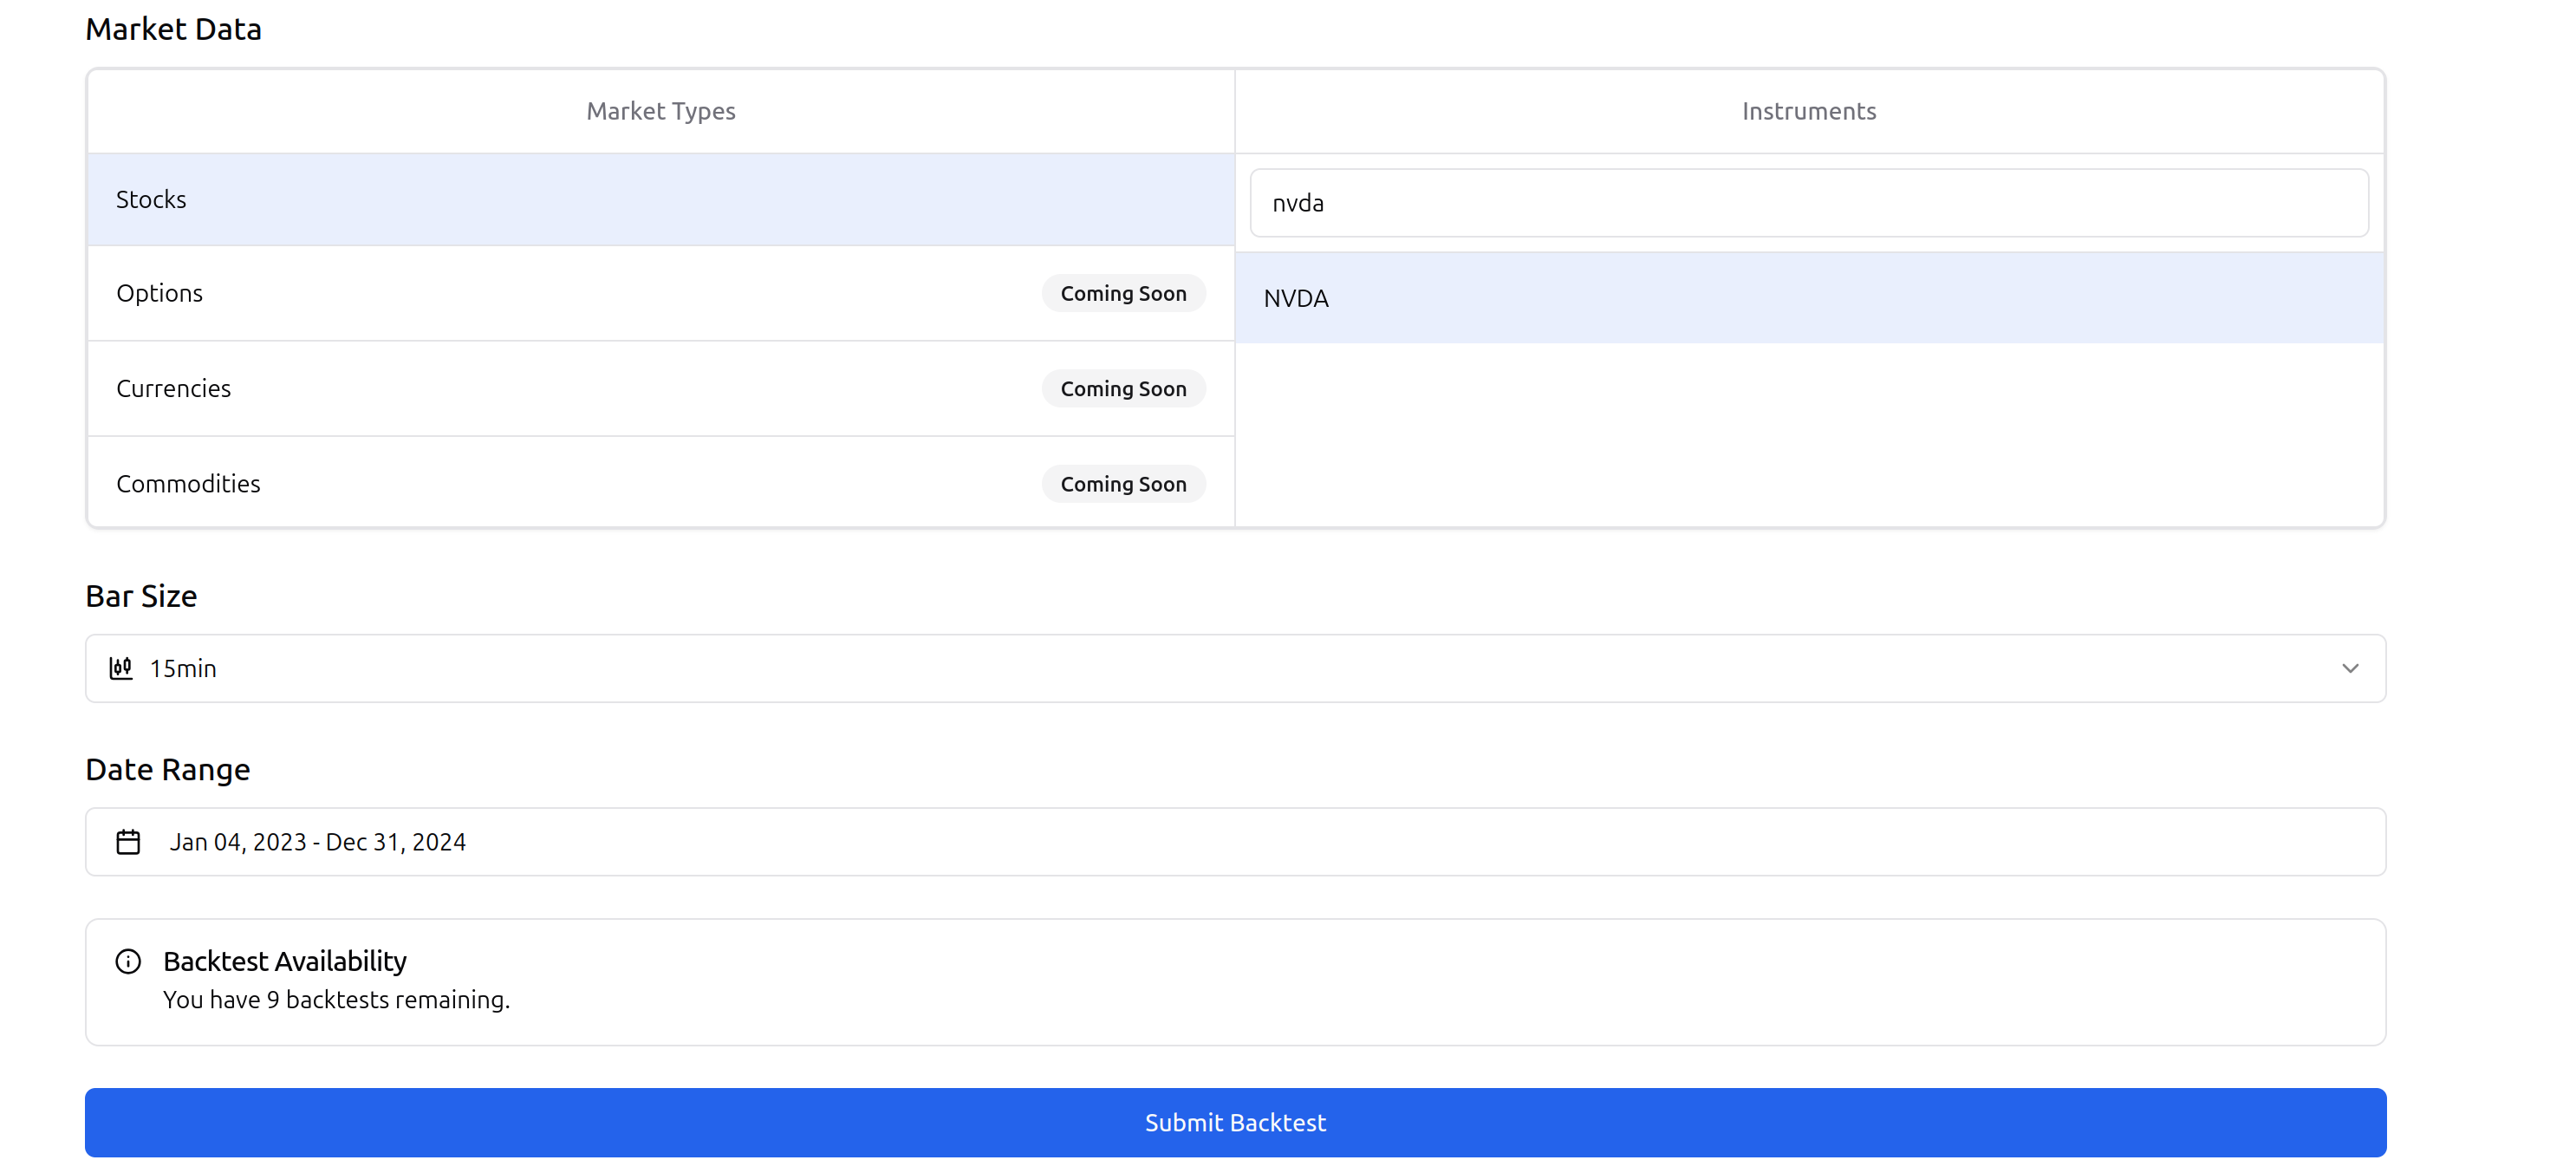
Step 2: Run the Backtest
Click "Run Backtest" and wait for Trade Labs to process the results. This shouldn't take more than a few minutes, depending on the length of your backtest period.
Step 3: Analyze the Results
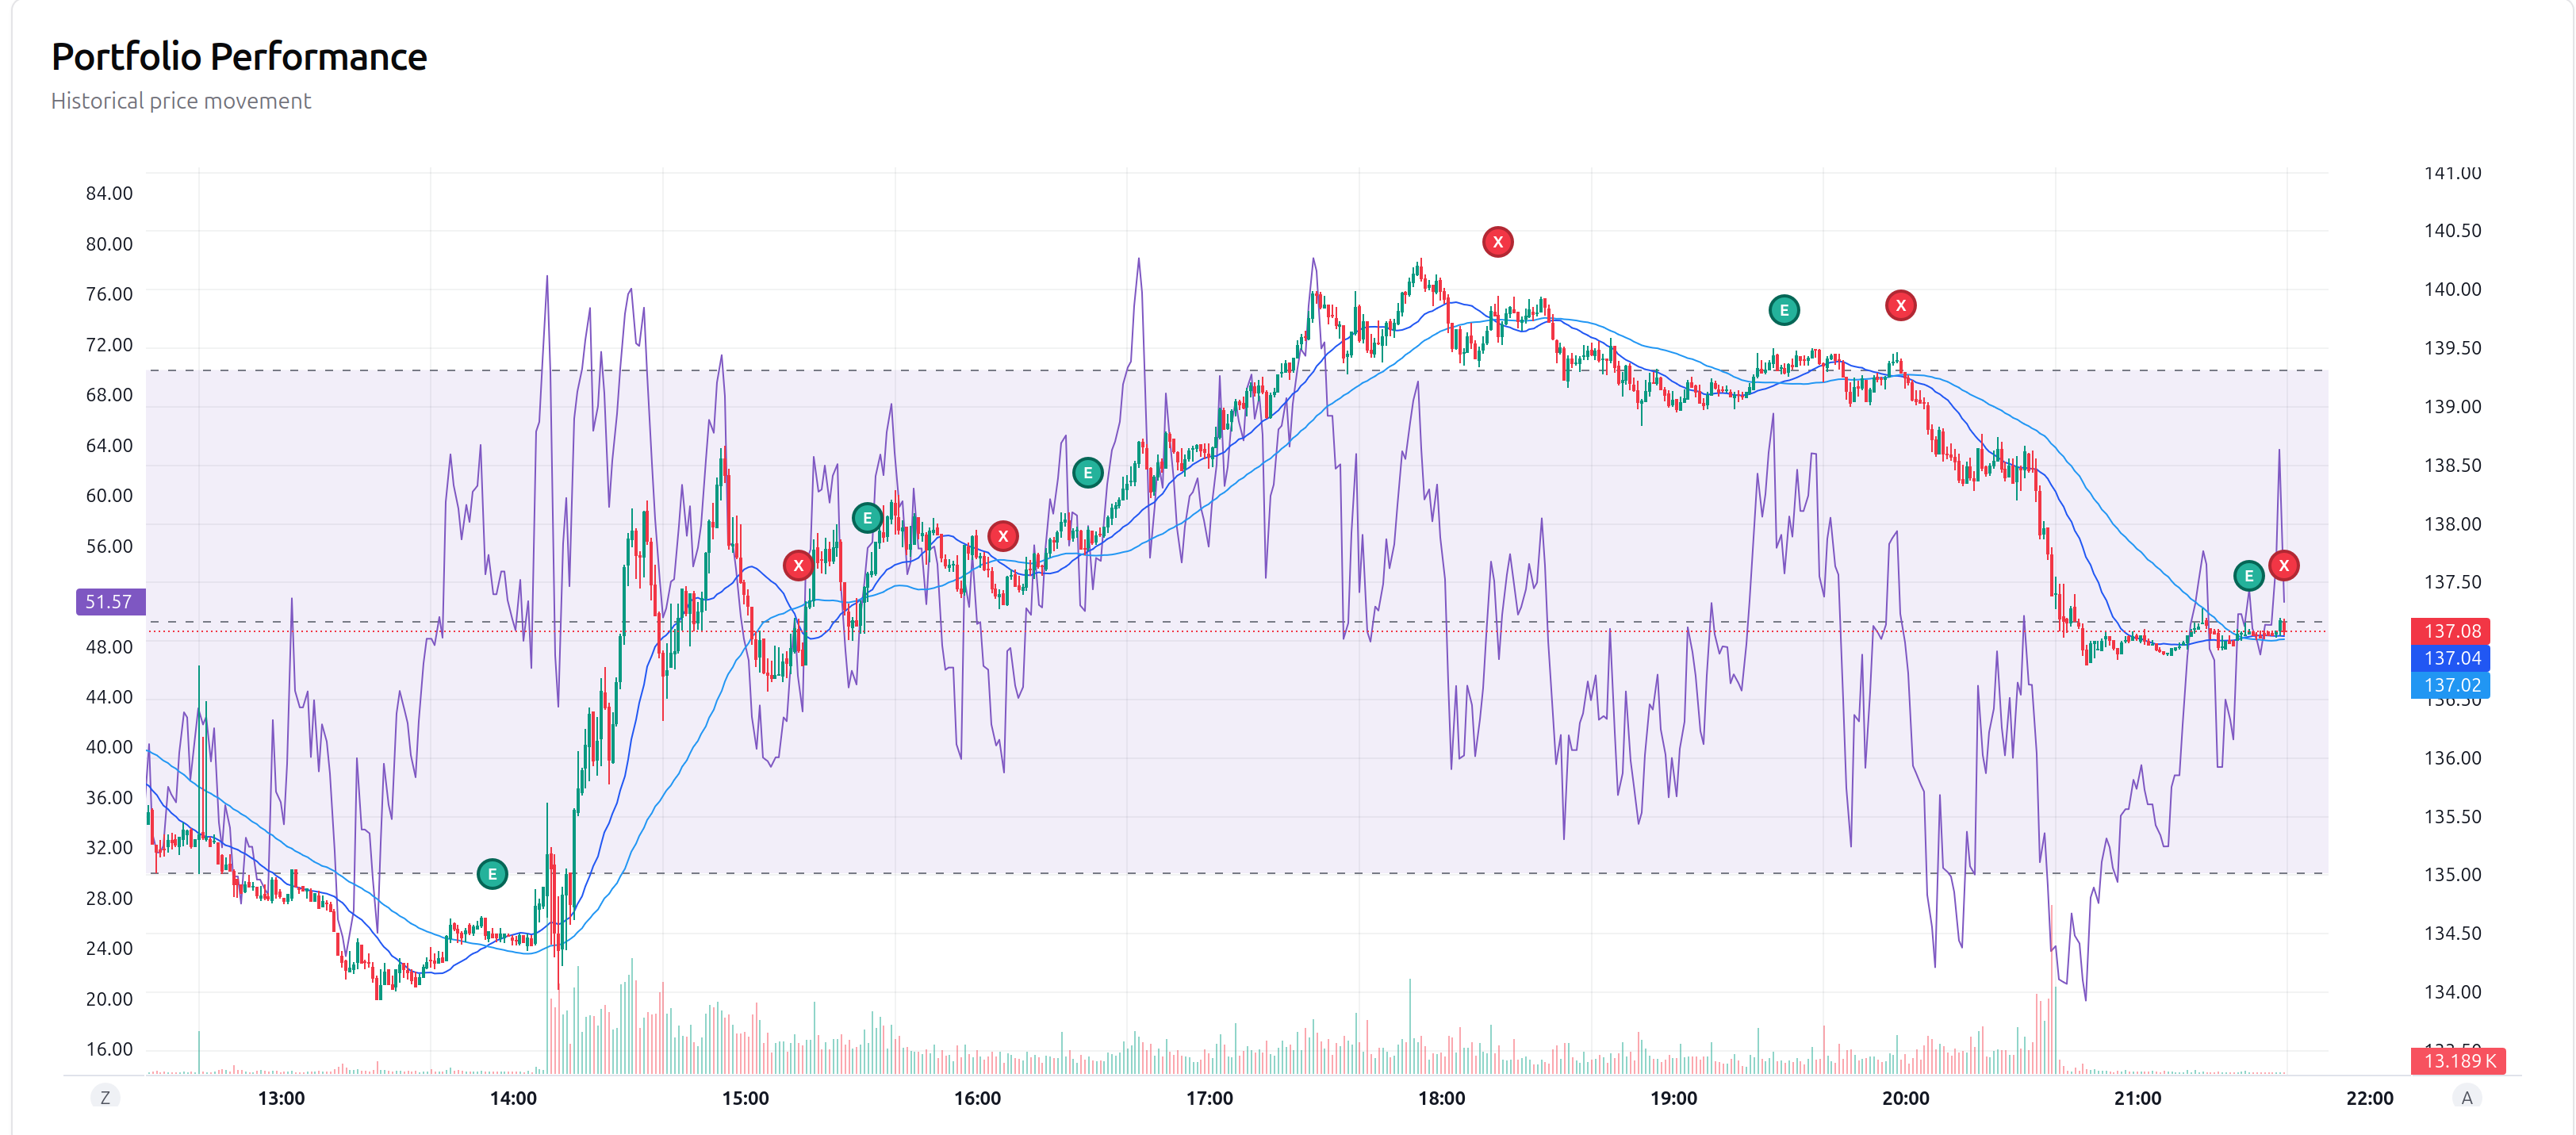
After running the backtest, you'll see a comprehensive performance report. Here's what our strategy yielded:
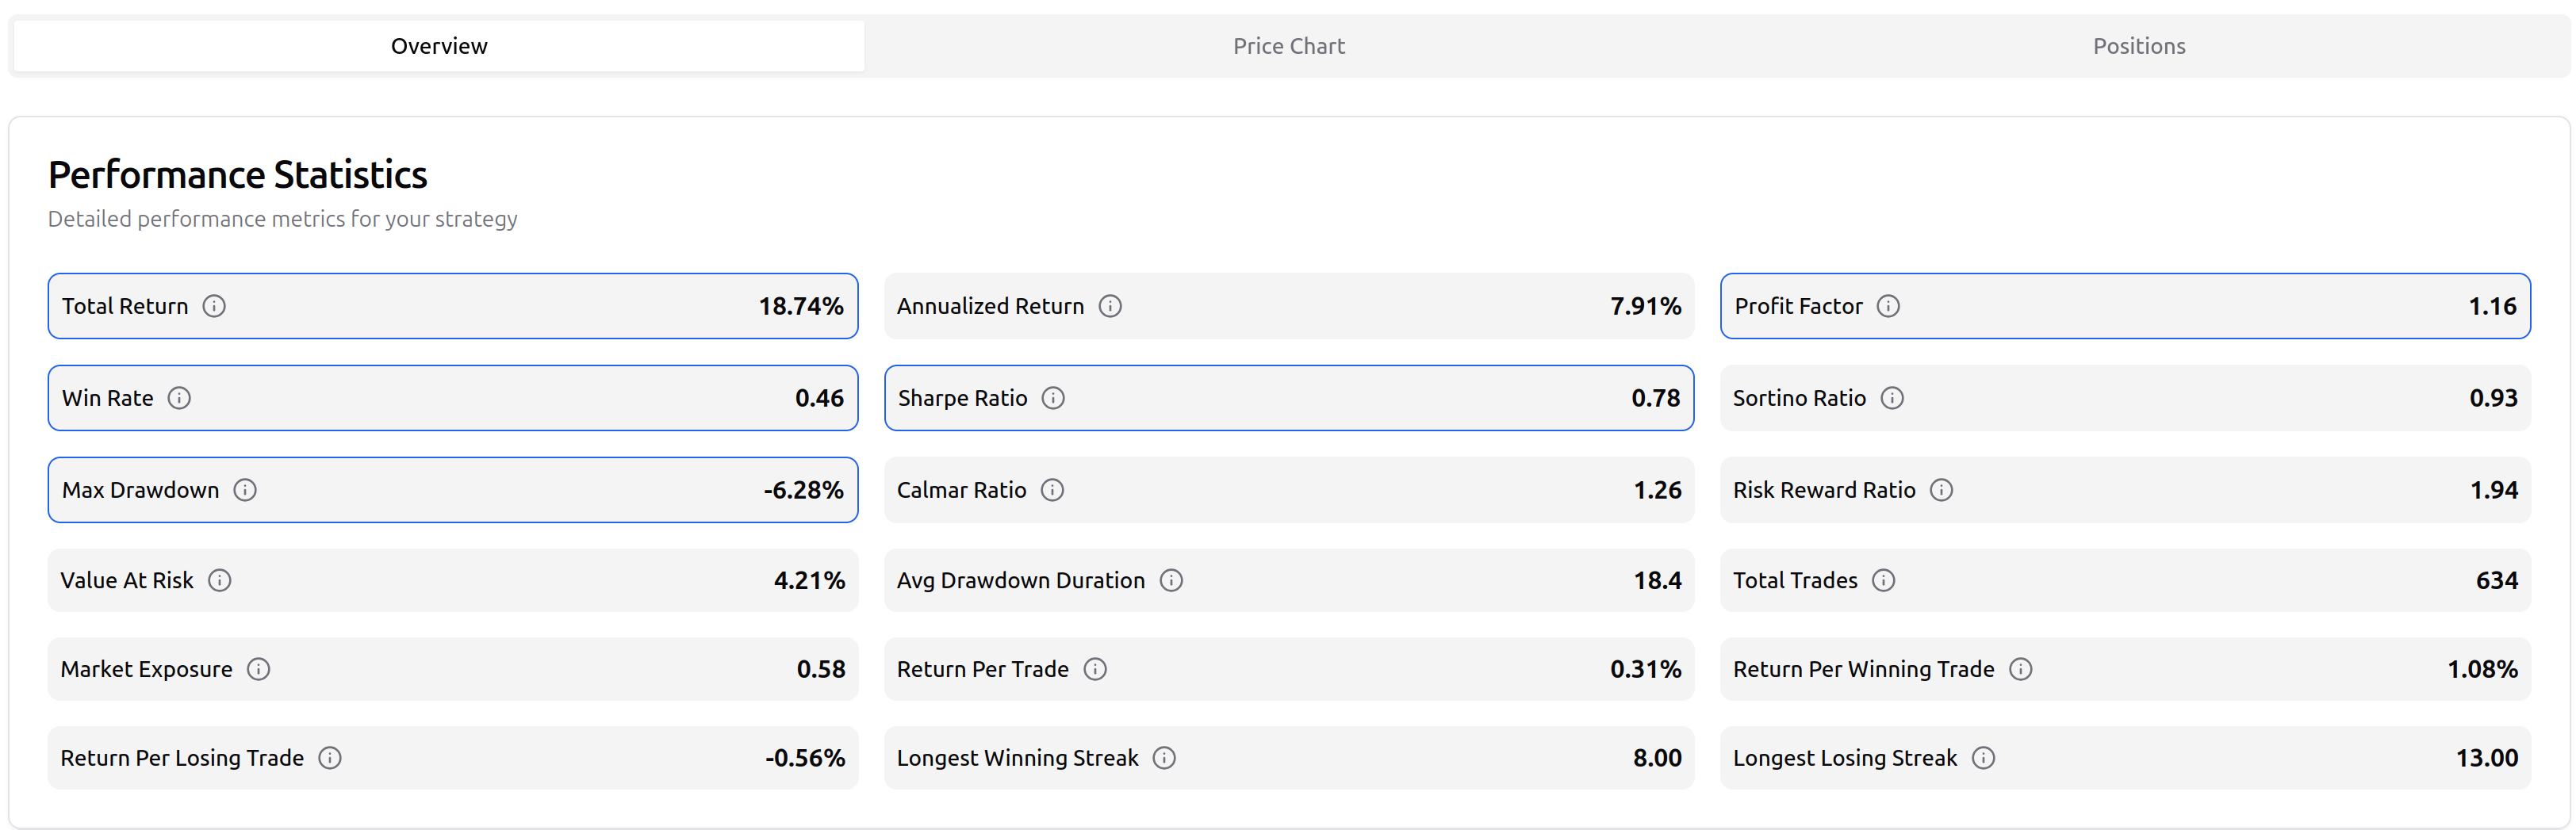
Key metrics from our backtest:
- Total Return: 18.74%
- Annualized Return: 7.91%
- Maximum Drawdown: -6.28%
- Win Rate: 46%
- Profit Factor: 1.1.16
Take a look at the price chart to see the strategy in action:
Analyzing Strategy Performance
Looking at the backtest results, we can make several observations:
Strengths
- The strategy performed well during trending markets
- The RSI filter helped avoid some false signals
- The risk-reward ratio contributed to overall profitability
Weaknesses
- The strategy underperformed during range-bound markets
- Several whipsaw trades occurred during high volatility periods
- Performance varied significantly across different market sectors
Optimizing the Strategy
Based on the backtest results, we can make several optimizations:
- Adjust SMA Periods: Test different combinations of SMA periods (e.g., 15/45 or 25/60)
- Modify RSI Thresholds: Try different RSI levels (e.g., 35/65 instead of 30/70)
- Sector Rotation: Apply the strategy to different sectors based on their relative strength
Conclusion
The SMA-RSI combination strategy demonstrates the power of combining trend-following indicators with momentum oscillators. While no strategy works in all market conditions, this approach provides a solid foundation that can be customized to your specific trading goals and risk tolerance.
Trade Labs makes it simple to develop, test, and refine such strategies without requiring advanced programming skills. The platform's intuitive interface and comprehensive backtesting capabilities allow traders of all experience levels to improve their trading through data-driven decisions.
Remember that past performance doesn't guarantee future results, and always practice proper risk management regardless of how promising a strategy's backtest appears.